.png)
.png)
.png)

Most traders track their P&L. Fewer track their psychology. And almost none track the connection between the two with enough precision to actually change their behavior.
Psychology tracking works only when it becomes part of your daily routine — not a one-time audit after a bad week. Trandence is built around this principle. Every layer of the platform, from pre-market readiness scoring to algorithmic period reports, is designed to make the invisible visible: to surface the behavioral patterns that your raw numbers hide.
This guide walks through the complete psychology tracking workflow in Trandence — what to do, when to do it, and how the platform uses that data to generate insights you couldn’t find manually.
1. Score Readiness Before the Session
The first and most important psychology tracking input happens before you place a single trade.
Open your Daily Plan and score three dimensions from 1 to 5:
- Mental readiness: Focus, emotional state, decision clarity, and ability to sit with uncertainty
- Physical readiness: Sleep quality, energy level, physical condition
- Market readiness: Whether current market conditions fit your strategy and whether you have a clear plan for the session
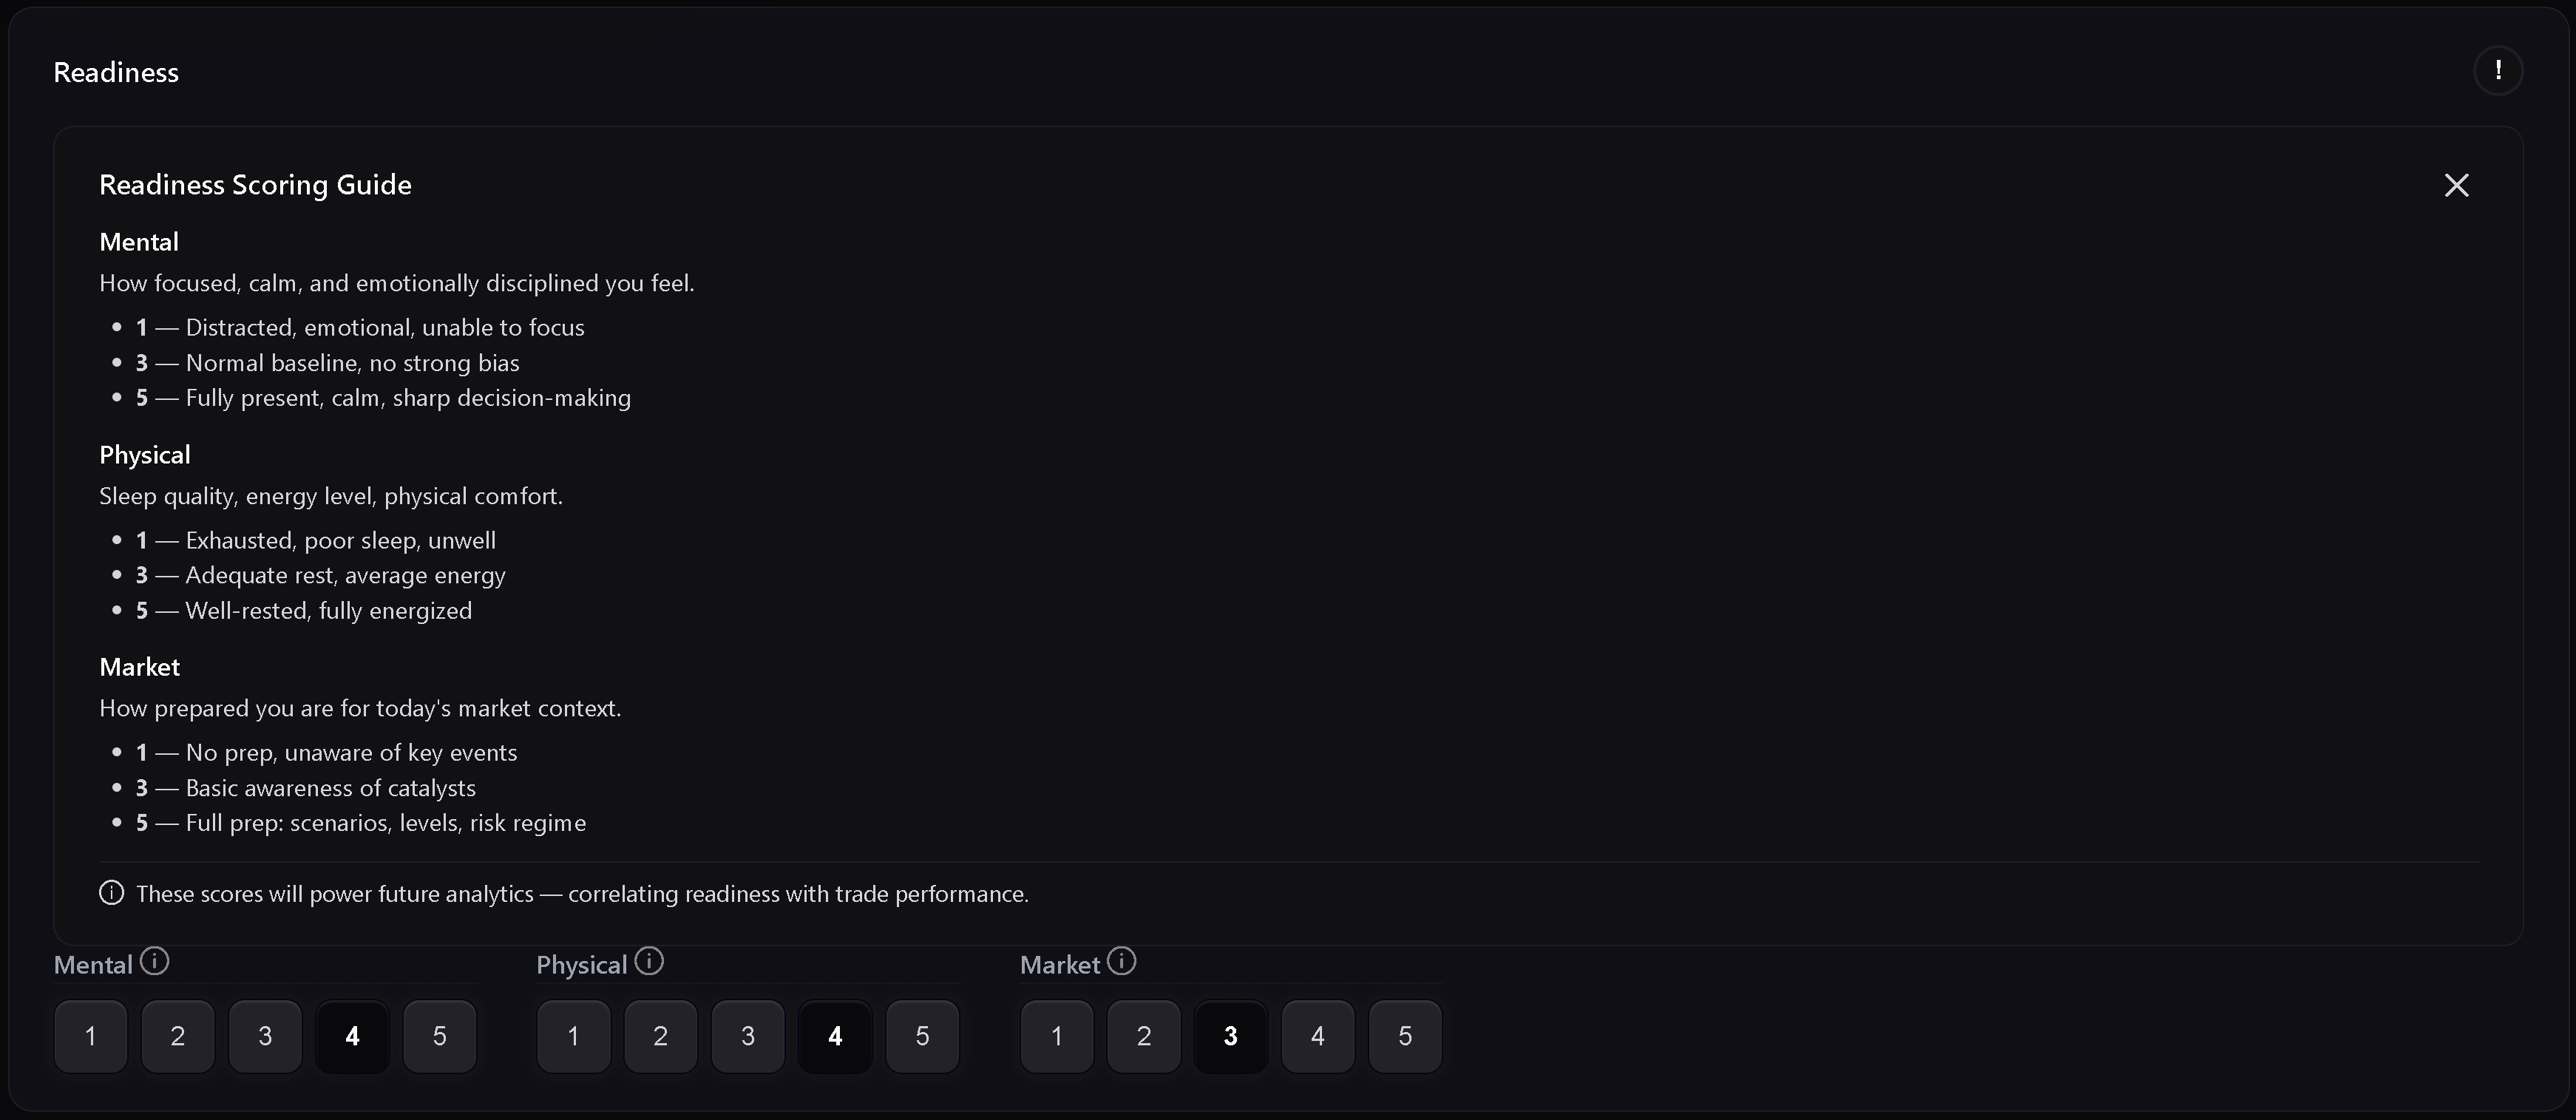
These aren’t just notes. Trandence uses your readiness scores to automatically adjust your risk framework for the session through four readiness zones:
- Green zone (high readiness): Full position sizing — conditions are optimal
- Yellow zone: 60% of normal position size — proceed with caution
- Orange zone: 30% of normal position size — significantly reduced exposure
- Red zone: 0% — the data says don’t trade today
This isn’t a suggestion. It’s a systematic risk control that removes the decision from the emotional moment. When you’re tired, distracted, or uncertain about the market — the readiness system enforces smaller size automatically, before you have the chance to override your own judgment.
Why this matters beyond the day: Trandence correlates your readiness scores with your P&L across your full trading history. The pattern that emerges is consistent and measurable: high readiness days produce systematically better results than low readiness days. Seeing that correlation in your own data — not someone else’s research — is what makes the readiness habit stick.
2. Complete the Post-Session Review
After the session closes, the daily review captures data that raw trade statistics can’t provide.
Quick Checks
Score three dimensions of session quality:
- Execution quality: Did you enter and exit according to your plan, or did you chase, hesitate, or override?
- Risk control: Did you respect your stops and position sizing rules?
- Plan adherence: Did you trade the plan you wrote before the session?
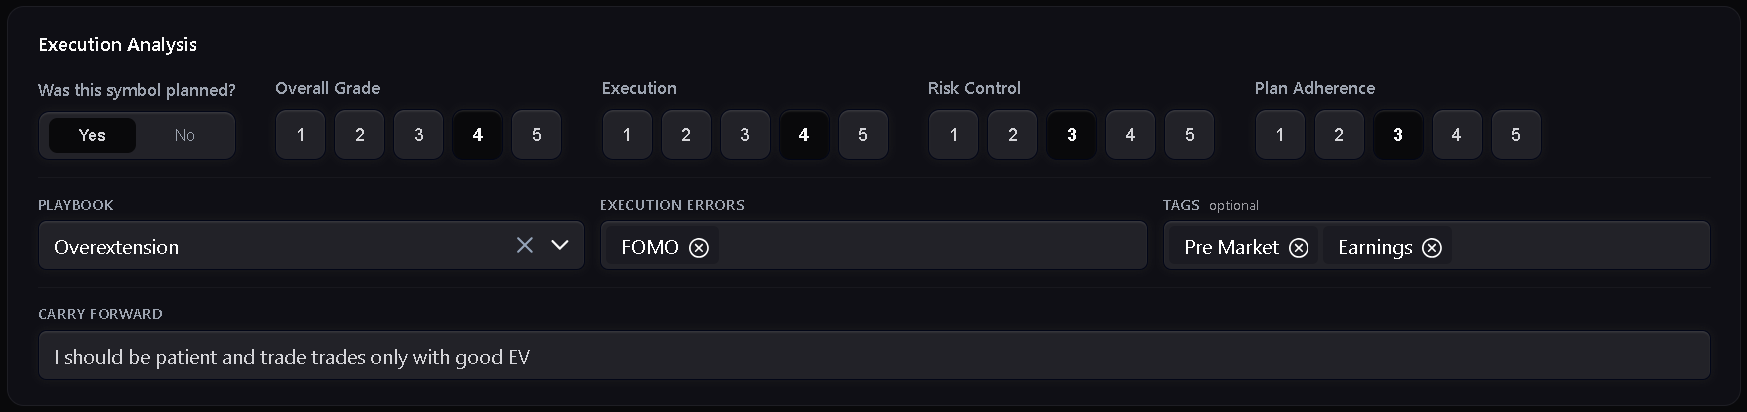
Do this even on green days. A profitable session with poor discipline is more dangerous than a small red session that followed the plan — because the profitable undisciplined session teaches your brain that breaking rules works.
Discipline Score
Beyond the three Quick Check dimensions, Trandence tracks a separate Discipline Score for each session. This score feeds into the Discipline Radar — a five-axis visualization that tracks your performance across:
- Execution
- Risk management
- Patience
- Consistency
- Mental stability
The radar view makes it immediately visible when one dimension is consistently weaker than the others. A trader who scores well on execution and risk management but consistently low on patience has a specific, addressable problem — not a generic “discipline issue.”
Narrative Fields
The post-session journal includes structured fields that go well beyond Quick Checks:
- What worked: Capture the patterns and decisions that generated results
- What didn’t work: Specific mistakes, not vague dissatisfaction
- Post-market reflection: Honest summary of the session’s psychological quality
- Improvements: Concrete changes to make in the next session
These fields matter because patterns in your own words — recurring phrases, recurring mistakes — are often more revealing than numerical scores.
3. Use Tags and Notes to Capture What Numbers Miss
Symbol Reports give you space to attach mistake tags, regular tags, and reflections to specific trade sequences. This is where you record the context that P&L cannot explain.
Common patterns worth tagging:
- Chased after the move had already happened
- Moved or ignored the planned stop
- Took a trade that wasn’t in the plan
- Increased size for emotional reasons
- Continued trading after the session’s edge was gone
Playbook adherence as a discipline metric
Trandence goes beyond basic tagging by classifying every trade against your documented playbooks:
- PLANNED: The trade matched a documented setup and was executed as intended
- ADAPTED: The setup changed during the trade but the adaptation was deliberate and reasoned
- TRADED: The trade happened but wasn’t categorized before entry
- UNCATEGORIZED: No playbook was assigned — the strongest signal of emotional or undisciplined trading
The UNCATEGORIZED classification is where most behavioral leaks hide. A session where 40% of trades are UNCATEGORIZED tells you something specific: you stopped trading your strategy and started reacting. No amount of reflection notes captures this as precisely as the playbook adherence data.
A review is only useful if it’s honest. If you hide the mistake from the journal, you hide the pattern from yourself.
4. Understand What Triggers a Behavioral Badge
Trandence automatically flags trades that match known emotional patterns. These badges appear in the Trades view, Calendar, price action charts, Dashboard, and period insights.
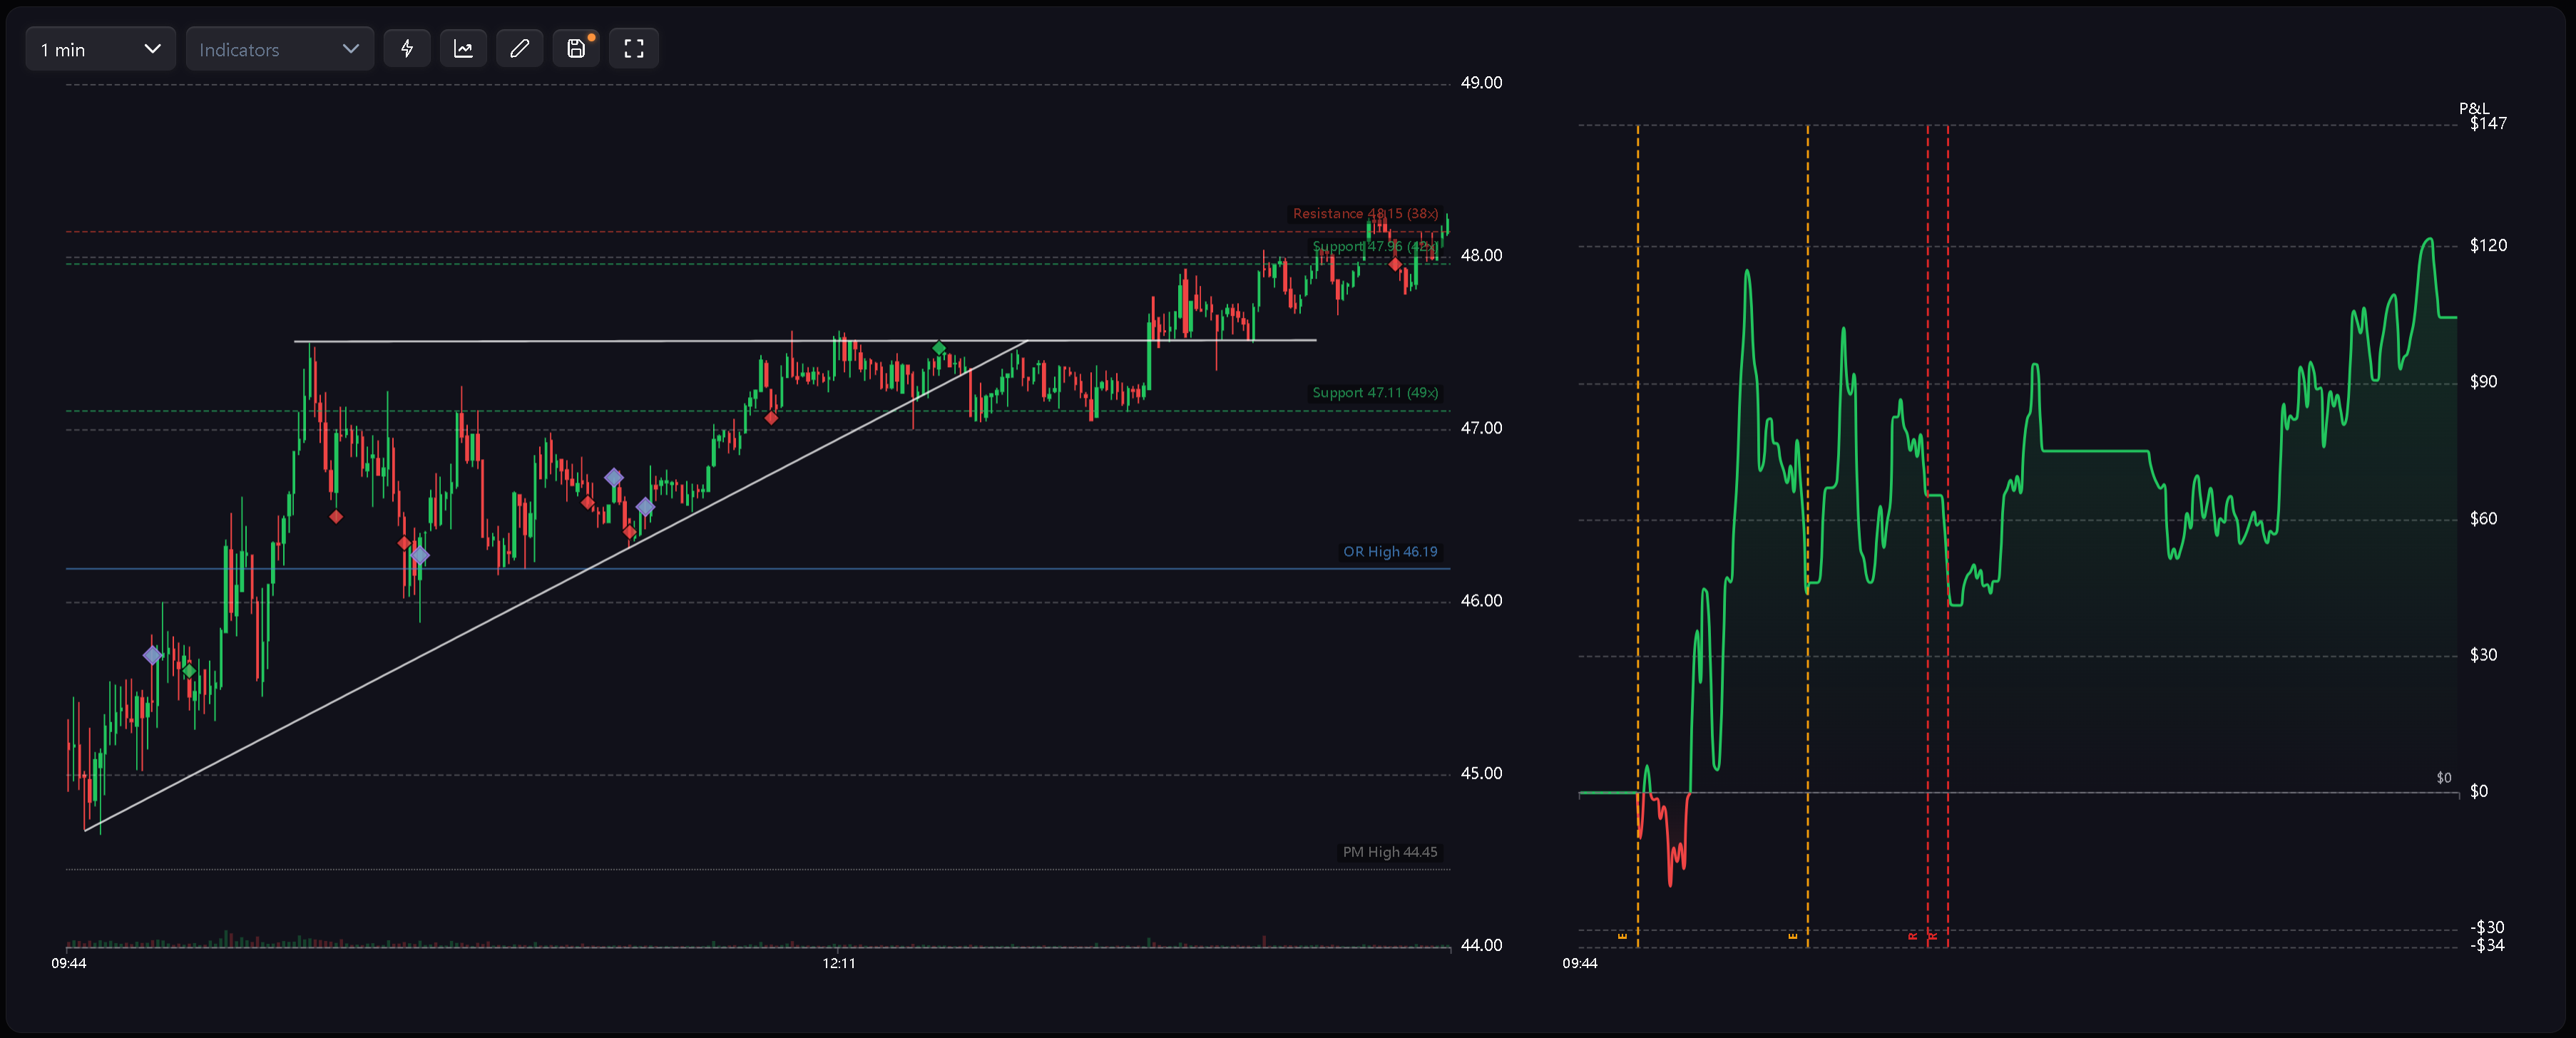
Understanding the specific logic behind each badge makes them more useful as review tools:
Time Revenge — Any trade entered within 5 minutes of closing a losing trade (across any symbol). Five minutes isn’t enough time to re-evaluate a setup or reset emotionally. Re-entry within that window is almost always driven by the loss, not the next opportunity.
Revenge Sizing — Any trade where your dollar exposure is 1.3× or more than the previous losing trade’s exposure (configurable). This catches the unconscious pattern of increasing size after a loss to “make it back faster.”
Desperation Entry — The trade entered after 3 or more consecutive losses. Trade quality declines measurably after a loss streak. The decision to continue trading is increasingly driven by the need to win rather than the presence of a clean setup.
Euphoria — The trade entered after 3 or more consecutive wins. The risk here is the opposite of desperation: overconfidence that lowers the bar for entry quality after a win streak.
Catastrophic Averaging — Adding to a losing position when the total loss reaches 30% of your daily stop loss. This is the pattern that turns controlled losses into account-threatening damage.
Every threshold is configurable. Day traders, swing traders, and hybrid traders have different natural patterns. A 5-minute Time Revenge window that’s appropriate for a scalper may produce false positives for a trader holding positions for hours. Trandence provides Day Trader, Swing Trader, and Hybrid presets as starting points, with every individual threshold adjustable to match your specific trading style.
Use badges as prompts, not verdicts. When a badge appears, the useful questions are: What was happening before this trade? Was I following my plan? What would I do differently?
5. Grade Your Psychology with Data & AI Prompts
This is the most powerful layer of psychology tracking in Trandence — and the one most traders underuse.
Trandence reviews your complete data: trade timing and sizing, behavioral badge counts, playbook adherence, readiness scores, fee drag, and giveback patterns through deterministic metrics and exportable AI prompts:
Session Review & Deterministic Signals
The post-market review produces a structured assessment of the session’s psychological quality. It calculates:
- Intraday giveback as a percentage of peak P&L
- Dollar cost of Time Revenge trades in the session
- Cost of tilt after a loss streak
- Trade duration asymmetry (are you cutting winners short and holding losers long?)
- Overtrading relative to your baseline
- Stop loss adherence weighted against your readiness zone
If the session’s pre-market plan wasn’t completed, or if stop loss rules were violated while in a low readiness zone, Trandence flags the breakdown in risk management.
Every session is also compared against your 30-day baseline. This context matters: a session with 8 trades might be normal for one trader and overtrading for another. The system calibrates its assessment to your historical patterns, not generic benchmarks.
Period Report (Algorithmic)
The Period Report synthesizes data across a completed period — monthly, quarterly, or yearly — into a structured, deterministic report:
- Verdict Line: Overall discipline and execution summary
- Where the money went: Leaks ranked by dollar impact (fees, costly hours, revenge re-entries, overtrading)
- What works: Proven execution strengths
- Rules for next period: Actionable rules built directly from your numbers
The Period Report explicitly connects behavioral patterns to dollar outcomes. “Your Time Revenge entries cost you $2,340 this month” is a different kind of feedback than “try to be more patient.” One is information you can act on. The other is a suggestion you can ignore.
Copy Prompt for AI
To get deep qualitative analysis on your trading psychology without sending private data to cloud services, Trandence lets you copy structured prompts with your exact numbers directly into your preferred AI assistant (Claude, ChatGPT, Gemini, or any other).
The prompt includes your pre-trade self-assessment, actual execution, readiness zone, playbook rules, and self-grades, asking the assistant to evaluate whether deviations from the plan were deliberate adaptations to changing conditions or genuine emotional errors.
6. Track Weakness Trajectory Over Time
Individual session data tells you what happened today. Weakness trajectory tells you whether you’re improving.
Trandence tracks the trend of each identified weakness over time, classifying each as IMPROVING or WORSENING. This trajectory data appears in the Period Report and Dashboard insights.
A trader whose Time Revenge count is declining month over month is making genuine behavioral progress — even if they still have some flagged trades. A trader whose count is increasing despite awareness of the pattern has a structural problem that awareness alone isn’t fixing.
The trajectory view prevents the common self-assessment bias where traders feel like they’re improving because they’re aware of their mistakes, even when the data shows the behavior isn’t changing.
7. Review Trends Weekly
At the end of each week, spend 15 minutes with Dashboard Analytics, Calendar period insights, and your completed Daily Plans.
The questions that produce the most useful insights:
- Does poor readiness correlate with worse execution in your data?
- Are UNCATEGORIZED trades concentrated on specific days, times, or after specific events?
- Do behavioral badges cluster after losing sessions or after winning sessions?
- Is your Discipline Score improving or declining across the week?
- What does your weakness trajectory show for your top two behavioral patterns?
The goal of the weekly review isn’t to judge the week. It’s to identify the one specific pattern most worth addressing in the next week’s plan. One concrete adjustment, made consistently, produces more improvement than a list of good intentions.
The Complete Psychology Tracking Loop
The system works as a loop, not a checklist:
Pre-market: Readiness score → risk zone calibration → daily plan with specific rules
During the session: Playbook assignment → behavioral badge detection (automatic)
Post-session: Quick Checks → Discipline Score → narrative review → session review
Weekly / Period: Period Report → weakness trajectory → one specific adjustment to next period’s plan
Each layer feeds the next. Readiness scores make your session review more precise. Post-session reviews make the Period Report and AI prompts more specific. Weekly patterns make the next pre-market plan more targeted.
Psychology tracking isn’t a separate activity from trading. Done correctly, it’s the feedback system that makes your trading process self-correcting.
Ready to build a data-driven psychology practice? Start your free account — behavioral detection, algorithmic period reports, and discipline scoring are all included.
.png)
.png)