How To Stop Revenge Trading: Using Data To Detect Emotional Tilt
You take a clean setup. Price hits your stop. The loss stings — not because it was large, but because it felt undeserved.
Within minutes, you’re back in. Different ticker, same thesis, slightly bigger size. You tell yourself you’re being disciplined. You’re not. You’re revenge trading.
This is one of the most common and most destructive patterns in day trading. It doesn’t look dramatic in the moment. It feels like recovery. But the data tells a different story — and that’s exactly the problem. Without data, you can’t see it clearly until the session is already over.
This article breaks down what revenge trading actually is, why it’s so hard to catch in real time, and how to use behavioral data to detect it before it becomes the session.
What Revenge Trading Actually Is
Revenge trading happens when a loss triggers an emotional response that overrides your decision-making process. The next trade is no longer about edge. It’s about recouping — about restoring your sense of control after something went wrong.
The behavior takes several forms:
Time-based revenge. You re-enter a position within minutes of closing a losing trade. The setup hasn’t changed. The thesis hasn’t been re-evaluated. You just couldn’t sit with the loss.
Revenge sizing. You increase your position size after a loss. The logic feels reasonable — “I need to make it back faster” — but what you’re actually doing is adding risk when your judgment is most compromised.
Desperation entries. After several consecutive losses, you start taking setups you wouldn’t normally take. The bar for entry drops because the psychological need to win overrides the requirement for a clean setup.
Euphoria-driven overconfidence. This is the reverse version. After several wins, you start pressing — larger size, lower-quality entries, more trades than your playbook calls for. The feeling of momentum becomes the reason to trade, not the setup.
All of these share a common thread: the decision to trade is being driven by an emotional state, not by a legitimate edge.
Why It’s So Hard to Catch in Real Time
The uncomfortable truth about revenge trading is that it rarely feels like revenge trading while it’s happening.
In the moment, the internal narrative sounds like this:
- “This is a good location. I’m not chasing — the setup is there.”
- “I need to size up here because my conviction is higher.”
- “The stock is still in play. I’m not revenge trading, I’m managing a position.”
These rationalizations are convincing precisely because they borrow the language of discipline. They sound like process. But they’re emotion wearing the costume of logic.
This is why willpower alone doesn’t fix revenge trading. You can’t out-think an emotional state using the same emotional state. The review needs to happen after the fact — when the emotion has cooled and the data can speak without interference.
The problem is that most traders don’t have the data to do this properly. They remember that a session went badly. They don’t have a precise record of which specific trades were entered within five minutes of a loss, at what size relative to the previous trade, following how many consecutive losses.
That precision is what makes the difference between learning from a session and just feeling bad about it.
The Cost of Revenge Trading: What the Data Shows
Before looking at how to detect and stop revenge trading, it’s worth understanding what it actually costs.
Most traders dramatically underestimate the financial impact of emotional trading because they attribute losses to bad setups rather than bad process. The setup may have been reasonable. The problem was that it was taken in an emotional state, at the wrong size, at the wrong time.
When you look at the data across a full period, the pattern becomes clear:
Fee drag compounds rapidly. Revenge trading produces high trade frequency, and high frequency generates fees. A session that might have involved five planned trades turns into fifteen. Each additional trade adds commissions and ECN fees. In active day trading, fees can easily consume 30-50% of gross gains — or more. When emotional trading is layered on top, fees can exceed gross gains entirely, turning a nominally profitable strategy into a net losing one.
Giveback accelerates after the first tilt trade. Look at the intraday P&L curve of a revenge-trading session. There is typically a point where the curve peaks — often in the morning, when focus is high and setups are cleaner — and then begins to decline. That decline is rarely the result of one catastrophic trade. It’s the accumulated drag of multiple suboptimal decisions made in a deteriorating emotional state.
The loss streak compounds the behavior. After one revenge trade loses, the emotional pressure to recover increases. This makes the next revenge trade more likely, often at higher size. The sequence accelerates. What started as a $50 loss can become a $300 loss day not because the market moved against you, but because you kept trading after your edge was gone.
How Trandence Detects Revenge Trading Automatically
Identifying revenge trading after the fact requires two things: complete trade data and a consistent set of detection rules. Trandence provides both.
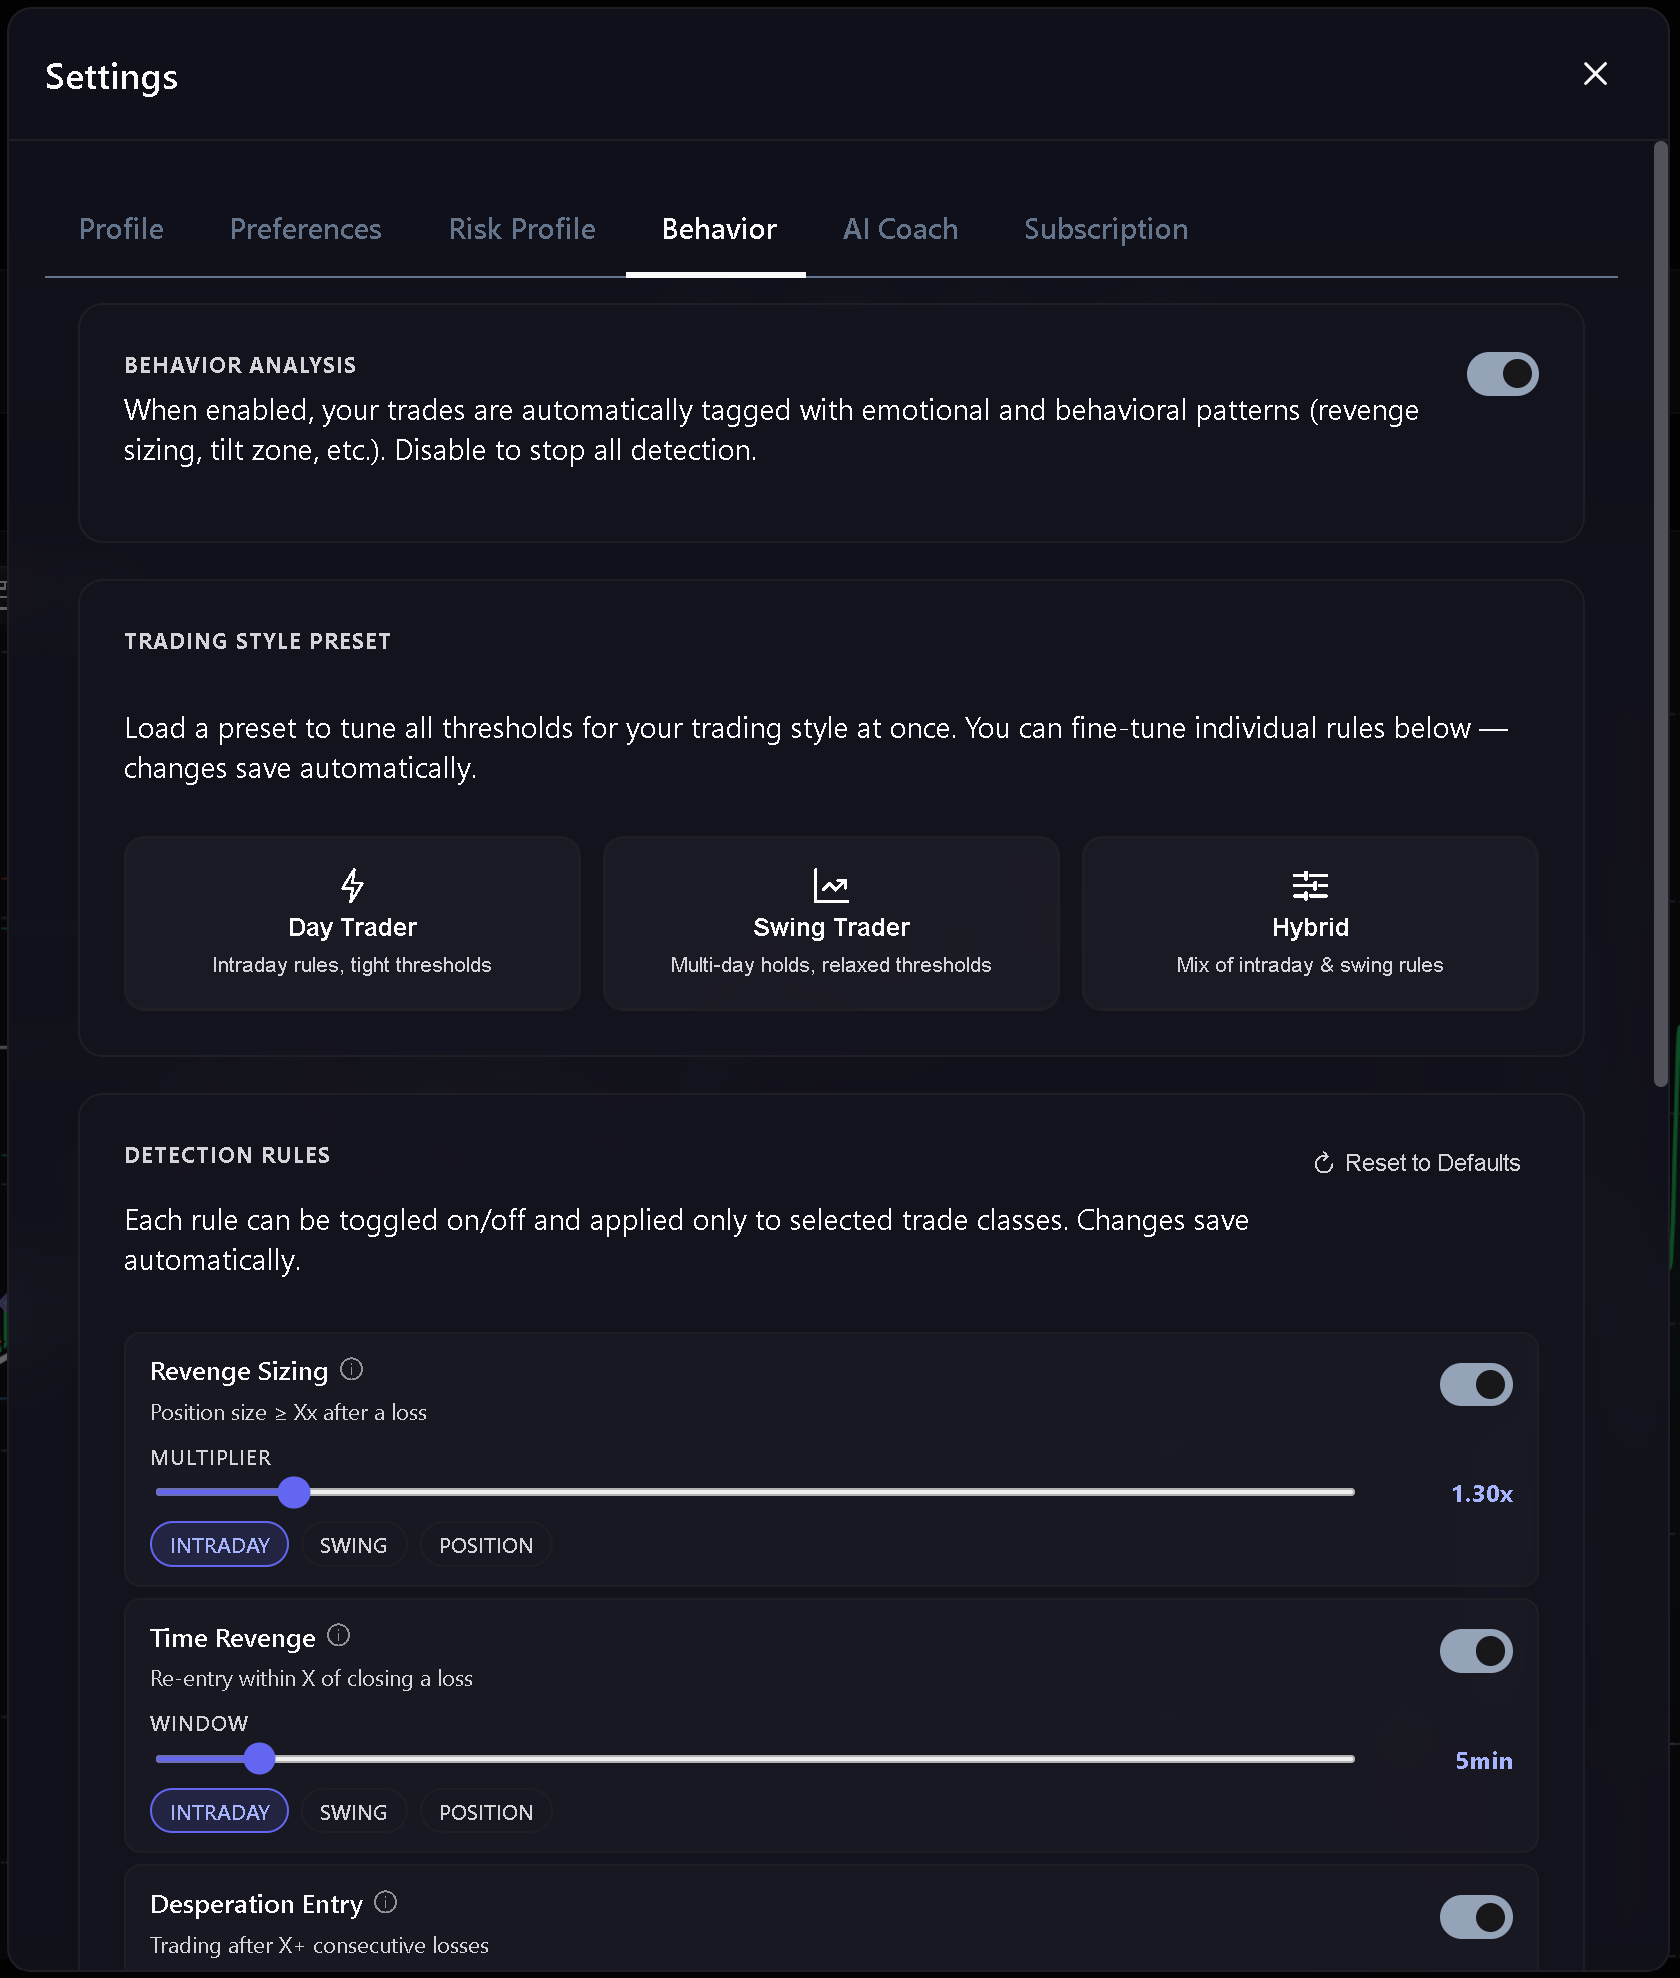
When behavior analysis is enabled, every trade you import is automatically evaluated against a set of behavioral heuristics. The system doesn’t rely on your self-reporting. It looks at the objective data — timing, sizing, sequencing — and flags patterns that match known emotional behaviors.
Here’s exactly what it detects:
Time Revenge
A trade is flagged as Time Revenge when it is entered within five minutes of closing a losing trade. The logic is straightforward: five minutes is not enough time to properly re-evaluate a setup, reset emotionally, or identify a new edge. Re-entry within that window is almost always driven by the loss, not the next opportunity.
This detection works across symbols. A loss on AAPL followed by an entry on NVDA within five minutes is still Time Revenge — the emotional trigger was the loss, regardless of the ticker.
Revenge Sizing
A trade is flagged as Revenge Sizing when the dollar exposure is 1.3x or greater than the previous losing trade’s exposure. This catches the specific pattern of unconsciously increasing size after a loss to “make it back faster.”
The threshold is configurable. Day traders using tight intraday rules might keep it at 1.3x. Swing traders with naturally wider position variation might adjust it higher to reduce false positives.
Desperation Entry
After three consecutive losing trades, any additional trade is flagged as a Desperation Entry. This doesn’t mean the fourth trade is necessarily wrong — but it means it deserves extra scrutiny. The data shows that trade quality tends to decline significantly after three consecutive losses, and the decision to continue trading is increasingly driven by the need to win rather than the presence of a clean setup.
Euphoria
The mirror of Desperation Entry. After three consecutive wins, any additional trade is flagged as Euphoria. The risk here is overconfidence — pressing into lower-quality setups because the recent win streak creates a feeling of invincibility.
Tilt Zone
When your drawdown from the session high reaches 70% of your daily stop loss, the session is flagged as entering the Tilt Zone. This is a structural warning: you are in the range where emotional decision-making is most likely to take over, and the cost of continued trading is highest.
Catastrophic Averaging
Adding to a losing position when the total loss reaches 30% of your daily stop loss is flagged as Catastrophic Averaging. This is the pattern that turns controlled losses into account-threatening damage — adding exposure precisely when the original thesis is failing.
Reading the Behavioral Data in Your Review
The badges that appear on your trades are not verdicts. They are review prompts — signals that say “look here more carefully.”
When you see a Time Revenge badge on a trade in your calendar, the review questions are:
- What happened immediately before this trade?
- Had I re-evaluated the setup, or was I re-entering out of frustration?
- What was my emotional state when I clicked buy?
- Did this trade have a defined stop and target before entry?
- Would I have taken this trade at the start of the session, with no prior losses?
The honest answers to these questions are more valuable than any single metric. The badge gets you to ask them. The review is where you actually learn.
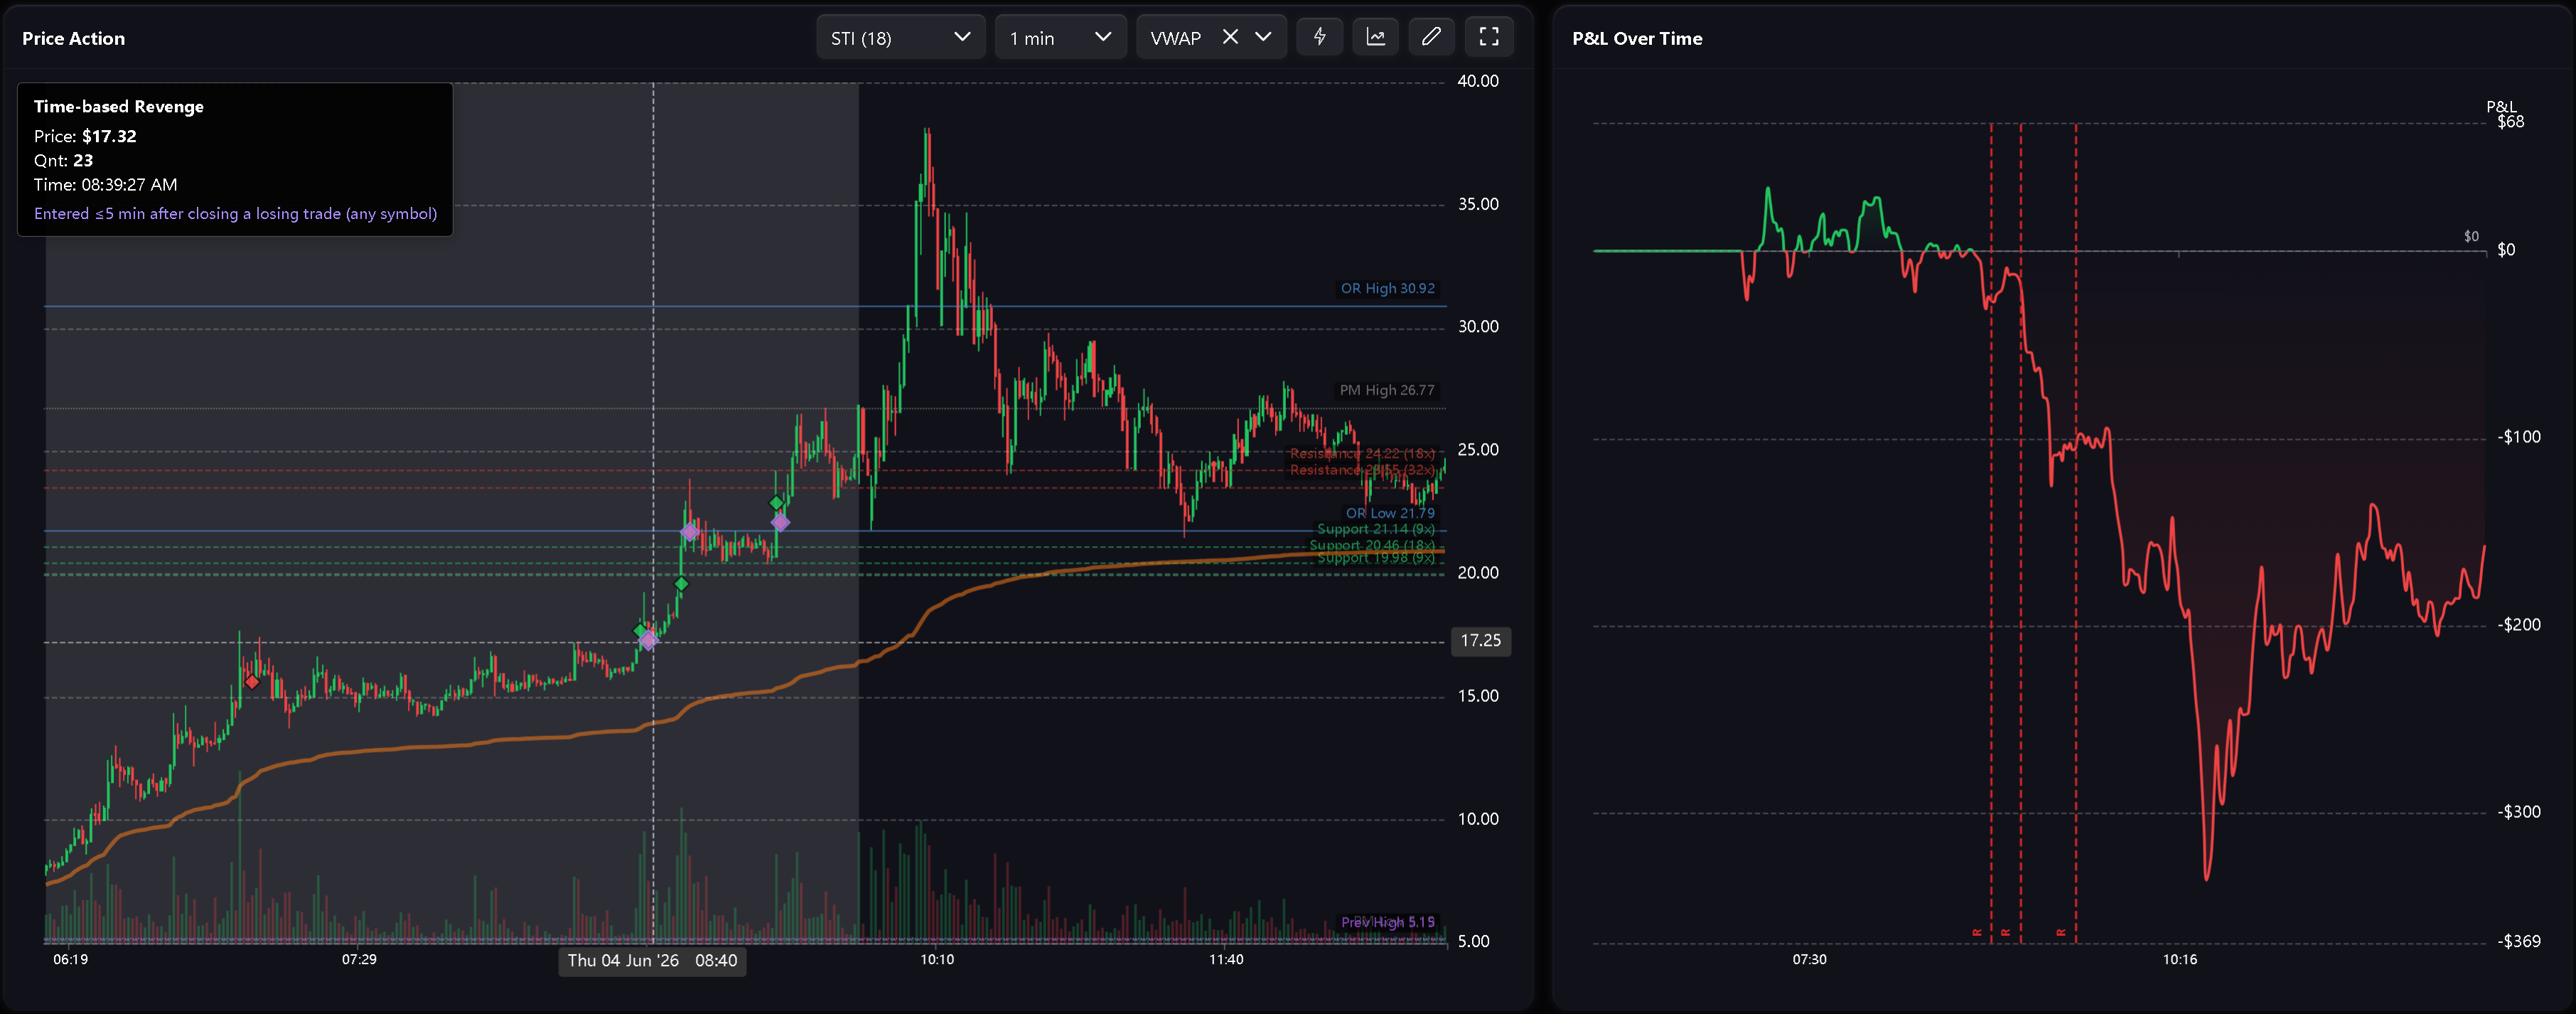
On the price action chart, Time Revenge and Desperation Entry trades are marked with diamond-shaped indicators. When you look at the P&L curve alongside these markers, the pattern becomes visually obvious: the curve typically deteriorates starting from the first tagged trade. This is the clearest possible demonstration of what emotional trading actually costs in a specific session.
The Behavioral Summary: Seeing the Full Picture
Looking at individual tagged trades is useful. Looking at your behavioral data across a full period is where the real insights live.
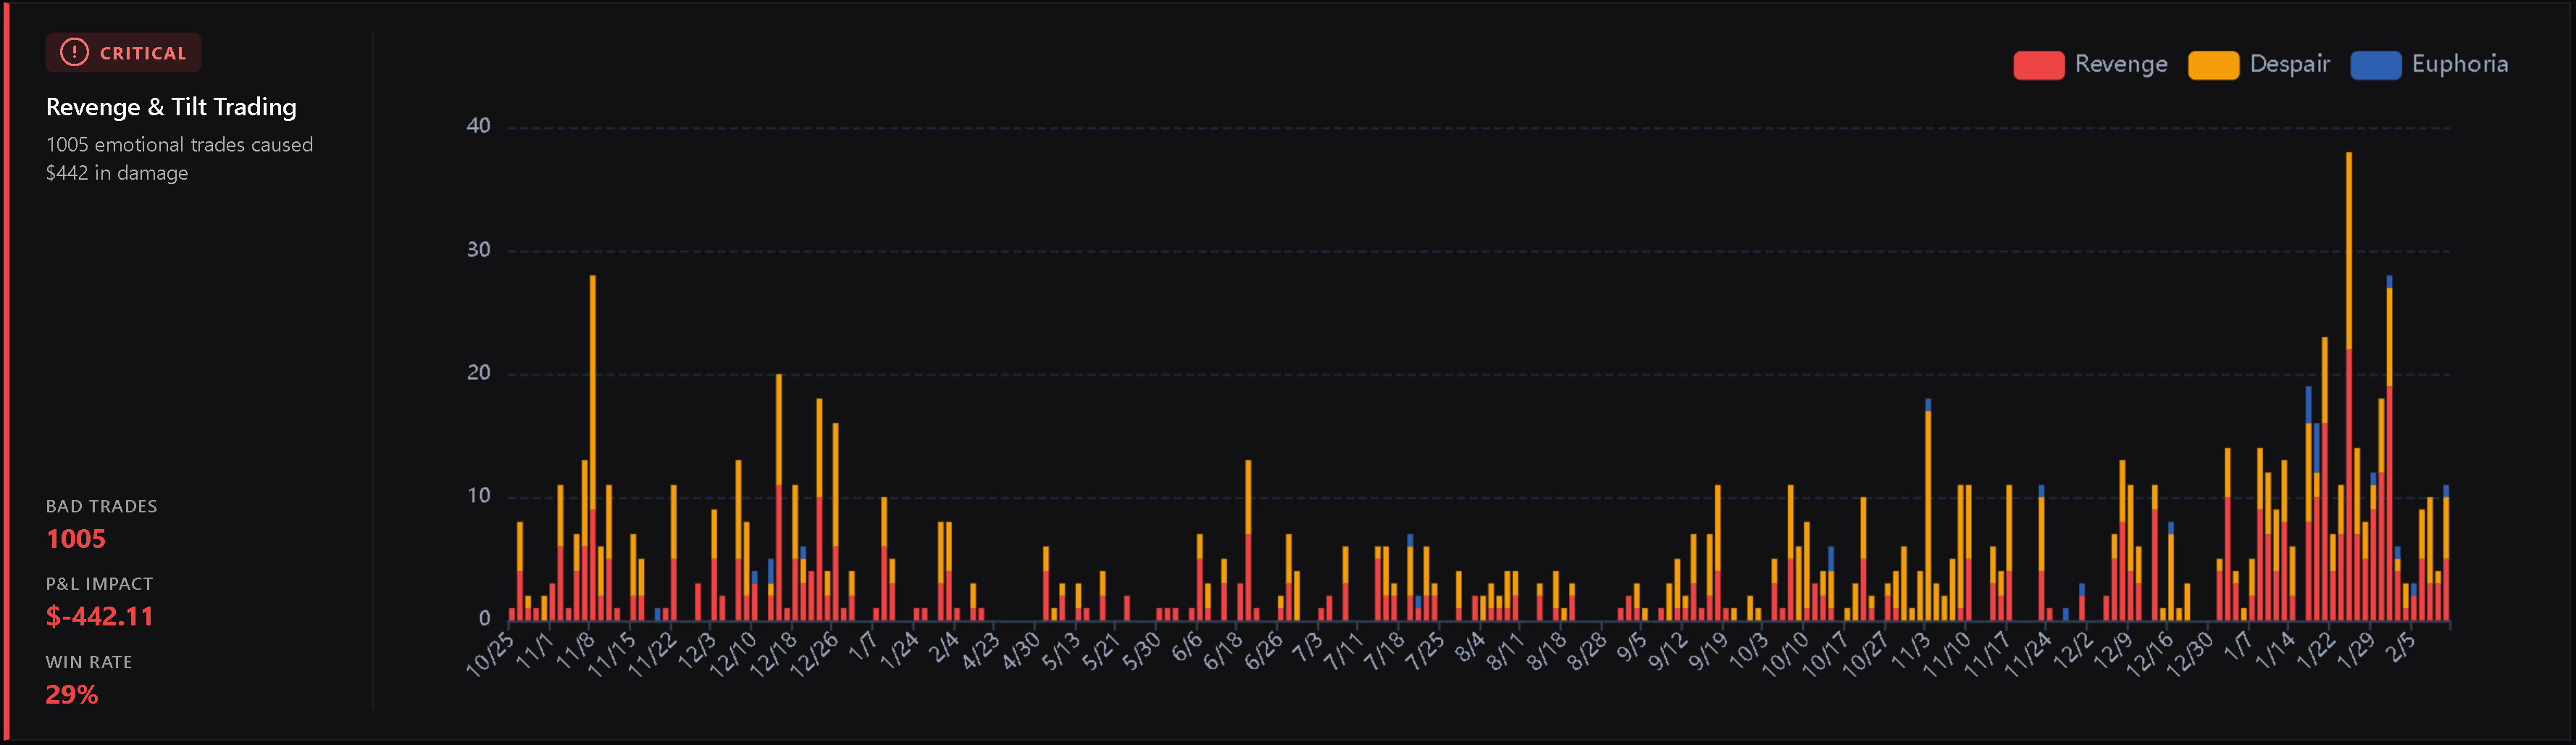
The Behavioral Summary in your dashboard shows:
- Total flagged trades — how many of your trades in the period were emotional, as a count and percentage of total trades
- Top Psychological Leak — which specific pattern cost you the most (Time Revenge, Desperation Entry, Euphoria, etc.)
- Behavior Frequency over time — whether emotional trading is improving or getting worse across weeks and months
- Cost of Tilt — the dollar difference between your actual P&L and what your P&L would have been if you had only taken disciplined, non-flagged trades
That last number is the one that changes behavior. Knowing abstractly that revenge trading is bad is one thing. Seeing that emotional trading specifically cost you $4,743 over a nine-month period — and that your account would be that much higher right now if you had stopped after the first loss each time — is something different.
It makes the invisible visible. And once you can see it clearly, you can work on it systematically.
Building a Protocol to Stop the Pattern
Data identifies the problem. Protocol prevents it from repeating.
If Time Revenge is your top psychological leak, the fix is not “try harder to stay calm.” The fix is a structural rule that removes the decision from the emotional moment.
Define a minimum reset window. After any losing trade, you do not re-enter for at least ten minutes. Not five — ten. The five-minute threshold catches the worst cases. The ten-minute rule gives your emotional state time to actually reset. Write this rule into your daily plan before the session starts.
Define a size reduction trigger. After two consecutive losses, your next trade is taken at half size. Not because the next setup is necessarily worse, but because your judgment is compromised and the cost of being wrong needs to be lower. This rule is written in your playbook, not decided in the moment.
Define a session stop trigger. Before the session starts, you write down the P&L level at which you stop trading for the day. When you hit that level, the session is over — regardless of what the market is doing, regardless of how confident you feel about the next setup. The daily hard stop is non-negotiable.
Use the pre-market readiness check. Your emotional state before the session starts predicts your behavior during it. On days when mental and physical readiness scores are low, the data consistently shows worse outcomes — more emotional trades, higher fee drag, more giveback. When readiness is low, trading smaller or not trading at all is a legitimate decision, not a failure.
The goal is to move as many decisions as possible out of the emotional moment and into the planning process. Rules written when you are calm protect you from decisions made when you are not.
What to Do After a Revenge Trading Session
The session ended badly. You know you revenge traded. What now?
First, don’t review the session immediately. Give yourself time to decompress before sitting down with the data. Reviewing while still in an activated emotional state produces defensive thinking, not useful analysis.
When you do review, use the behavioral data as your structure:
- Open the calendar view for the session
- Identify the first tagged trade — the point where emotional trading began
- Calculate what the P&L would have been if you had stopped at that point
- Review the price action chart for the sequence of tagged trades
- Write down one specific rule that would have prevented or shortened the sequence
That last step is the most important. The review is not complete until it produces a concrete rule — not a vague intention, but a specific, measurable condition. “I will not re-enter within 10 minutes of a losing trade” is a rule. “I will try to be more patient” is not.
Add that rule to your playbook or your daily plan template. The next session, it is part of your pre-market review.
The Bigger Picture
Revenge trading is not a character flaw. It’s a predictable response to loss in a high-stakes environment. Every trader experiences it. The difference between traders who improve and traders who don’t is not that some feel the urge and others don’t — it’s that some have systems to catch it early and others don’t.
Data is that system.
When you can look at a session and see exactly which trades were emotional, exactly what they cost, and exactly how the sequence developed, you are no longer relying on memory and feeling. You are working with evidence. And evidence is something you can actually act on.
The badge that appears next to a trade in your journal is not an accusation. It’s information. Used consistently, it becomes the foundation of a feedback loop that makes each week of trading slightly better than the last.
That’s what the data is for.
Ready to see your own behavioral patterns? Start your free beta account and import your first session — behavioral detection runs automatically on every trade.
Ready to Master Your Trading Psychology?
Join Trandence and let data-driven analytics detect tilt, enforce your playbook, and grade your execution — so you can trade with discipline.
Start Your Free Trial