Euphoria Trading: Why Winning Streaks Cause Your Biggest Drawdowns
Every trader fears the losing streak. The consecutive red days, the shrinking account, the creeping doubt about whether any of this actually works. We build rules around losing. We set daily stop losses. We step away after three bad trades in a row.
But ask experienced traders about their most devastating drawdowns — the ones that set them back months — and you’ll hear a different story. The biggest blow-ups rarely start with a losing streak. They almost always start immediately after a significant win.
This is Euphoric Tilt. It’s quieter than revenge trading, harder to recognize in the moment, and statistically more expensive over time.
What Euphoric Tilt Actually Is
Euphoric Tilt — sometimes called Winner’s Tilt — is the behavioral shift that happens when a strong winning streak or a single large gain alters your risk perception. The mechanism is psychological and biochemical at the same time.
After a significant win, your brain releases dopamine. This feels like confidence. It feels like clarity. It feels like you finally understand what you’re doing. What it actually is, is impaired risk assessment wearing the costume of competence.
This creates two dangerous effects that compound each other:
The Illusion of Control. When you’re losing, you’re naturally cautious. You second-guess entries, respect your stops, and think carefully about position size. When you’re winning, that caution evaporates. You feel like you’ve cracked the code. The market feels readable. Setups that you would normally pass on suddenly look obvious.
The House Money Effect. After booking profits, you unconsciously stop treating those gains as real capital. They become “the market’s money” — a buffer that exists to be risked. This is why traders who would never risk more than 2% of their account on a normal day will casually risk 10% after a good morning. The math hasn’t changed. The psychology has.
The result is predictable: you start taking lower-quality setups with worse expected value, at larger size, with less discipline around exits. You are pressing at exactly the moment when the market owes you nothing.
The Anatomy of a Euphoric Session
The pattern follows a consistent sequence. Understanding it is the first step to catching it early.
Stage 1 — The legitimate win. You take a clean setup that works exactly as planned. Your read was correct, your execution was disciplined, and the result reflects genuine edge. This is real. You earned it.
Stage 2 — The confidence shift. With profit on the board, your emotional state changes. You feel looser. The next setup looks cleaner than it probably is. Your internal risk filter is running at a lower sensitivity.
Stage 3 — The first press. You take a trade that’s slightly below your normal standard. Maybe the setup is there, but the location isn’t ideal. Maybe you size up because you’re already green and “can afford to give some back.” The trade loses. This feels like a minor setback, not a warning sign.
Stage 4 — The ratchet effect. Now you have a small loss eating into your profits, and the dopamine is wearing off. You need to protect the green day. You take another trade to “make back the small loss.” Then another. Each loss tightens the emotional grip. What started as Euphoric Tilt is now bleeding into revenge trading. The session that was up $300 at 10:00 AM closes red.
This sequence — often called a “round trip” — is one of the most common and most painful patterns in day trading. The data is unambiguous about how frequently it happens and how much it costs.
What the Data Shows
When you look at behavioral data across a full trading period, the cost of Euphoric Tilt becomes impossible to ignore.
The Behavioral Summary in Trandence tracks Euphoria as a distinct pattern: any trade taken after three or more consecutive wins. This is the point where statistical evidence shows decision quality begins to decline and position sizing begins to expand beyond what the setup justifies.
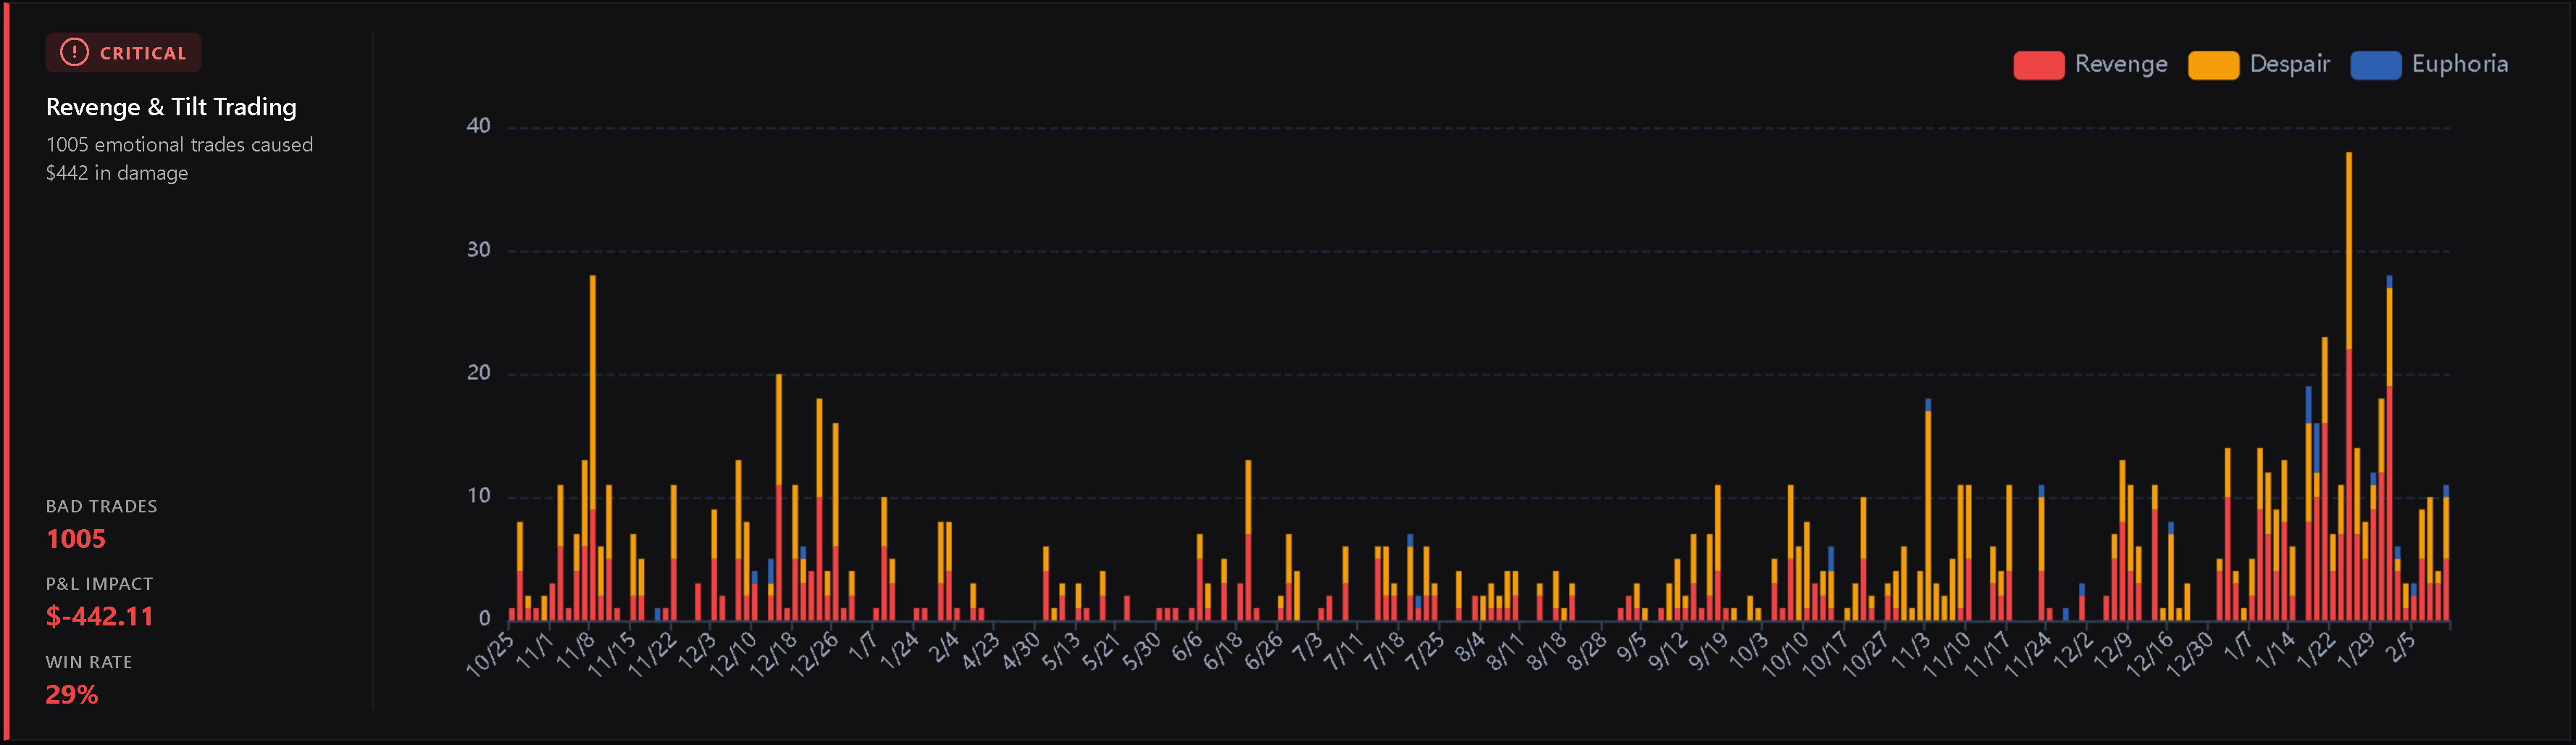
The numbers tell the story clearly. Across a trading period, emotional trades — including both Euphoria and revenge patterns — account for a disproportionate share of total losses. A trader with a 29% win rate and negative net P&L often has a perfectly reasonable gross P&L on disciplined trades. The destruction is concentrated in the flagged entries.
The Cost of Tilt metric makes this concrete: it calculates the exact dollar difference between your actual P&L and what your P&L would have been if you had only taken non-flagged, disciplined trades. For many traders, this number is larger than their total losses. The math shows that the problem isn’t their strategy — it’s the emotional trades layered on top of it.
The Excessive Giveback metric adds another dimension: what percentage of your peak intraday gains do you return before the session closes? A trader who peaks at +$300 and closes at +$80 has given back 73% of their gains. When this happens consistently, it’s not bad luck. It’s a structural behavioral pattern called Euphoric Tilt.
How Trandence Detects Euphoria Automatically
Manual self-monitoring during a live session is unreliable. When you’re in an elevated emotional state, your ability to accurately assess your own behavior is precisely when it’s most compromised.
Trandence tracks Euphoria automatically using behavioral heuristics applied to your imported trade data. The detection is objective — it looks at timing, sequencing, and sizing, not your self-reported emotional state.
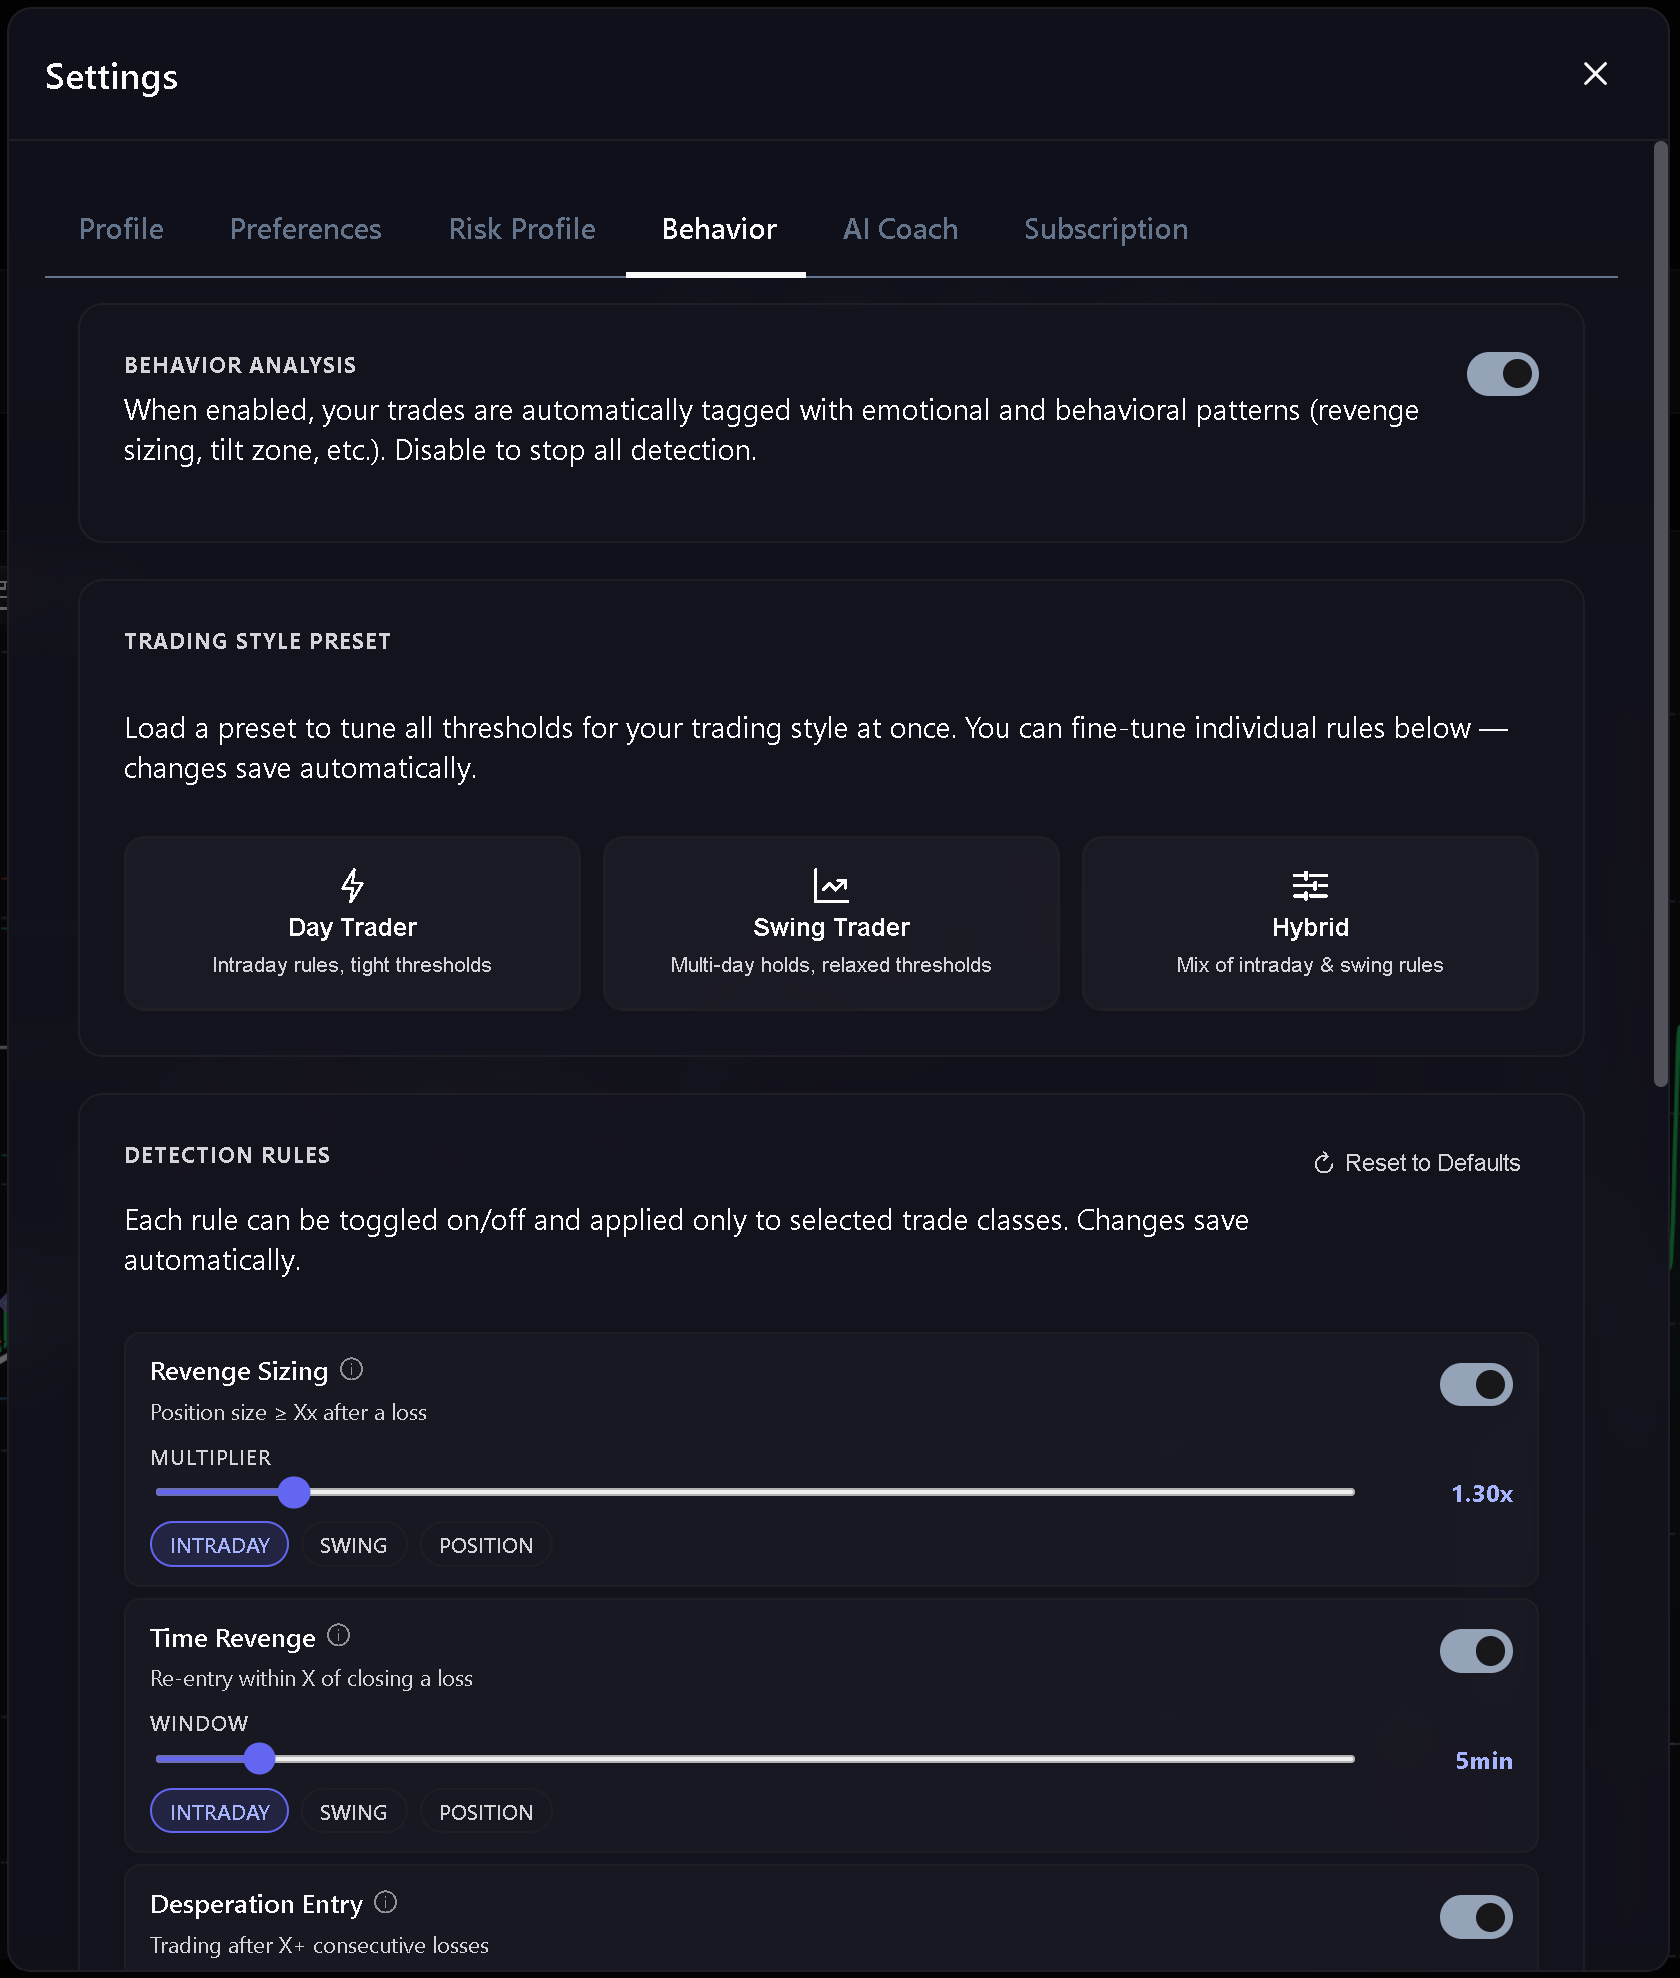
Euphoria detection flags any trade taken after three consecutive winning trades. The threshold is configurable — traders with naturally longer win streaks in their strategy can adjust it upward to reduce false positives. The default of three wins reflects the point where research and empirical trading data show behavioral drift beginning to occur.
Revenge Sizing detection catches the size escalation that often accompanies Euphoric Tilt — specifically, when position dollar exposure is 1.3x or greater than the previous trade. During euphoric states, traders routinely increase size without a conscious decision to do so. The badge makes the invisible visible.
Tilt Zone detection flags sessions where drawdown from the peak has reached 70% of the daily stop loss. This is the structural warning that a session is in dangerous territory — often the point where a winning morning is about to become a losing day.
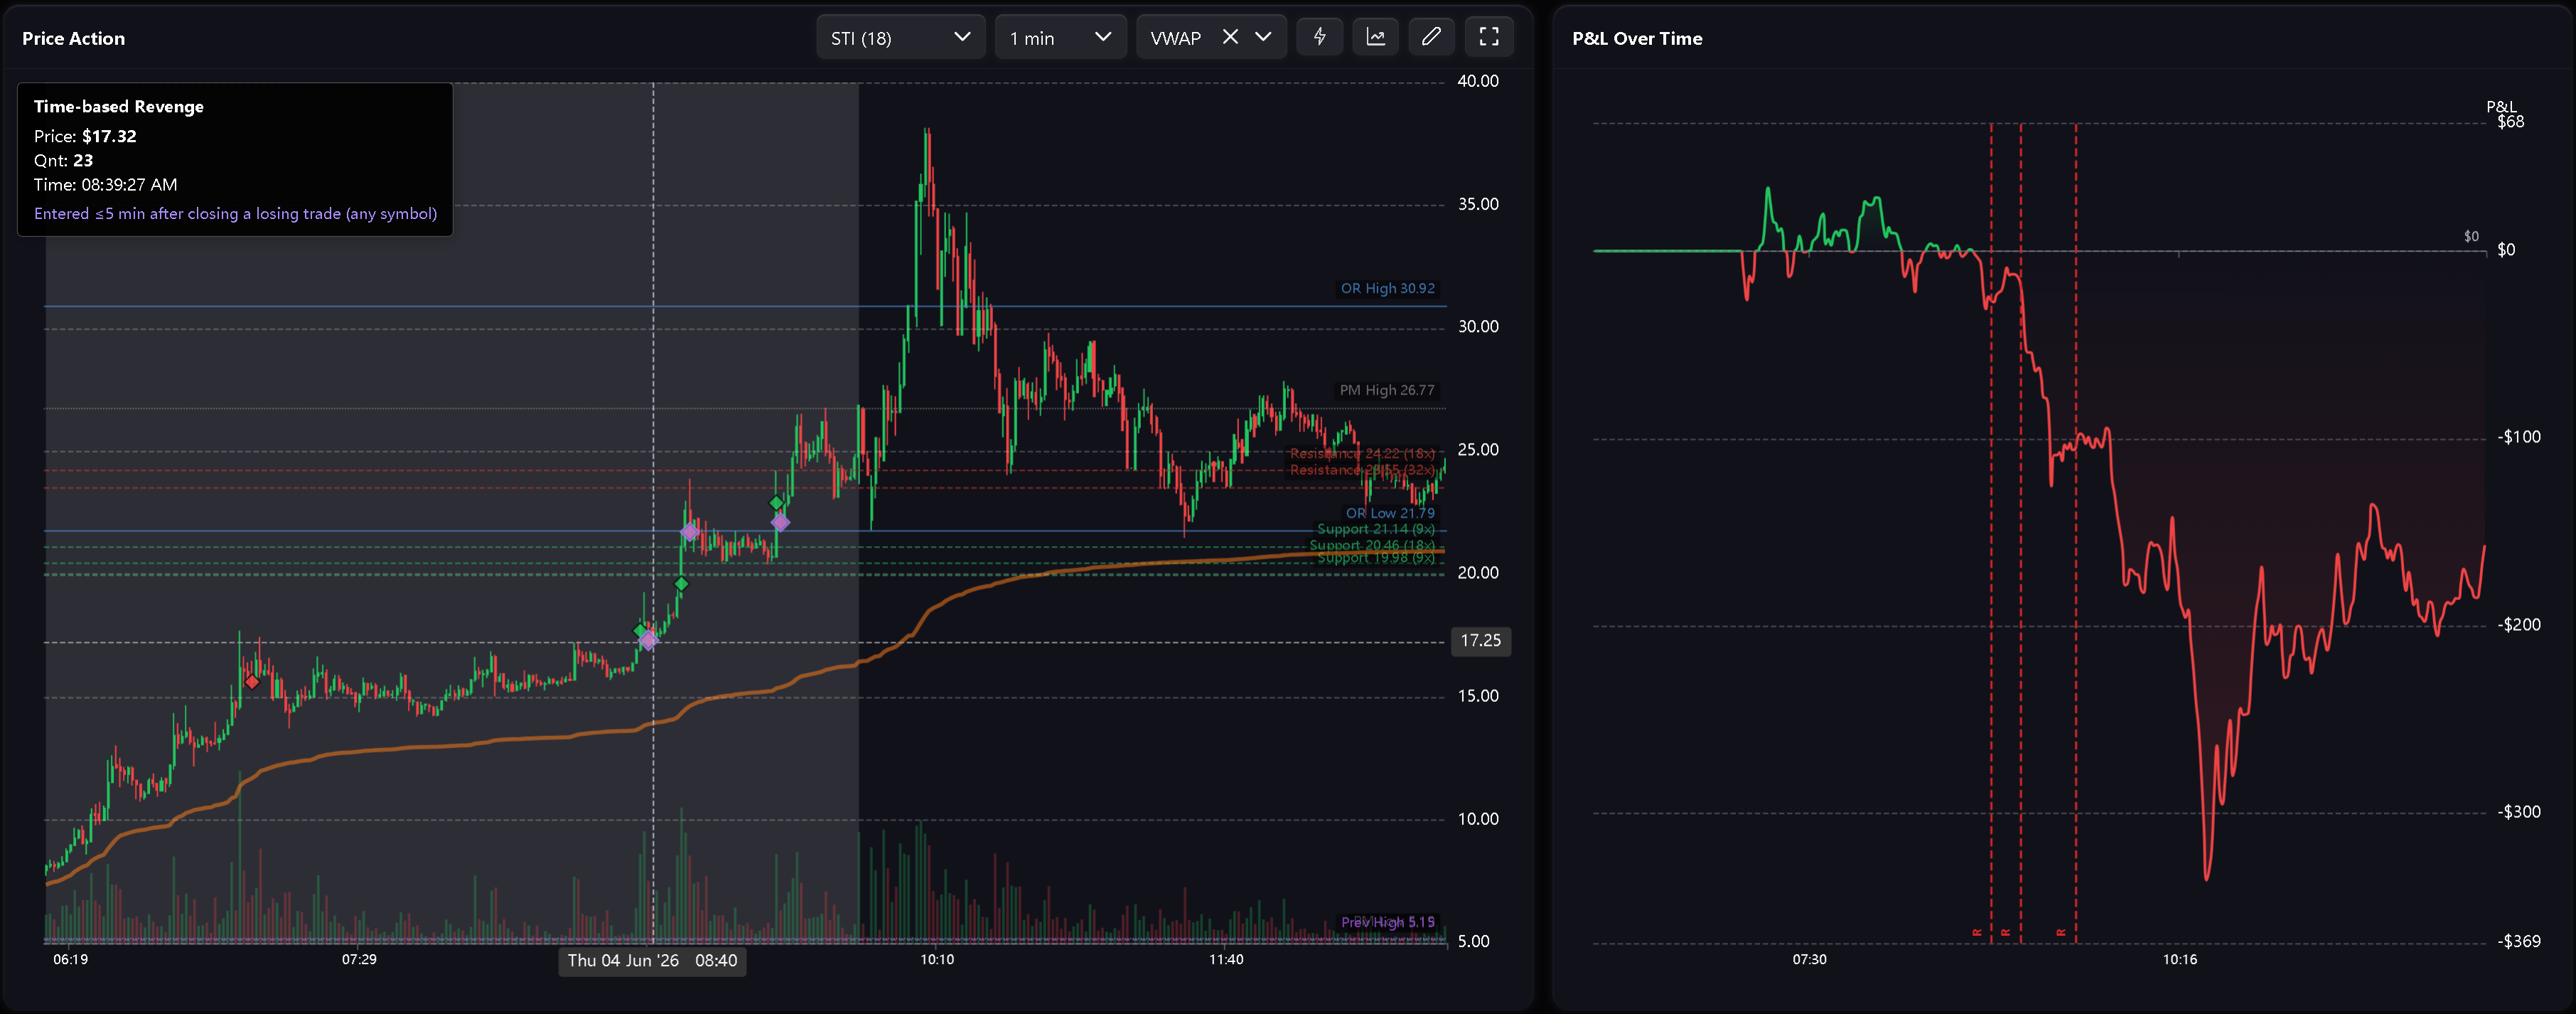
On the price action chart, Euphoria-tagged trades appear as markers at the exact entry point, overlaid on the candlestick data and key levels. When you look at a session where Euphoric Tilt occurred, the visual pattern is immediately recognizable: a cluster of entries after the session peak, each one slightly worse than the last, as the P&L curve reverses.
The Three Rules That Stop the Round Trip
Understanding Euphoric Tilt intellectually is not enough. The pattern persists because it’s operating below the level of conscious decision-making. Rules written in advance — when you are calm and not in an elevated state — are the only reliable defense.
Rule 1: Set a trailing stop on your daily P&L.
You use stop losses on individual trades. Apply the same logic to your session. Before the market opens, write down: “If I reach X in profit, my minimum close is Y.” A specific version: if you hit $300 in profit, you do not let the day close below $150. When P&L drops to $150, the session is over regardless of what the market is doing.
This rule sounds simple. It is extremely difficult to follow in the moment because closing a session while you’re still in a positive emotional state feels like leaving money on the table. That feeling is the tilt speaking, not your strategy.
Rule 2: Apply a post-win entry filter.
After two consecutive wins, every subsequent trade requires an explicit check: “Would I take this exact setup if I was flat on the day — no profit, no loss, fresh session?” If the honest answer is no, the trade doesn’t meet your standard. It’s a euphoria trade.
Write this question on a sticky note next to your monitor. Ask it out loud. The act of verbalizing it interrupts the automatic processing that Euphoric Tilt relies on.
Rule 3: Size down after a big win, not up.
This is counterintuitive and that’s exactly why it works. After your best trade of the session, reduce your size for the next two trades. Not because the next setup is worse — but because your judgment is most compromised right after a significant gain. Smaller size means smaller damage if the Euphoria pattern kicks in.
Add this rule to your playbook before the session starts. “After any single trade of +$X or more, next two trades at 50% normal size.” When the rule is written in advance, it removes the decision from the emotional moment.
Building the Review Habit
The rules above prevent Euphoric Tilt from starting. The review habit prevents it from recurring.
After any session where you gave back more than 50% of your peak profit, open the behavioral data before you close the platform. Specifically:
Look at the timestamp of your peak P&L. Identify the first trade taken after that peak. Check whether it carries an Euphoria badge. If it does, trace the sequence — how many trades followed before you stopped? What was the total cost of those trades? What would the session P&L have been if you had stopped at the peak or at the first flagged trade?
Write one specific rule that would have changed the outcome. Not a vague intention — a specific, measurable condition. “If P&L drops 30% from session peak, I close all positions and stop trading for 30 minutes” is a rule. “I will try not to give back profits” is not.
Add that rule to your daily plan template so it becomes part of the pre-market routine. Rules reviewed before the session starts are far more likely to be followed during it.
The Bigger Pattern
Euphoric Tilt and revenge trading are often discussed as opposite problems — one triggered by winning, one by losing. In practice, they frequently appear in sequence within the same session. Euphoria starts the round trip. When the profits evaporate and the losses mount, the emotional state shifts from overconfidence to desperation. What began as pressing after wins becomes chasing after losses.
This is why the Behavioral Summary shows both patterns tracked together as “Revenge and Tilt Trading.” They share a common root: a decision-making process that has been captured by emotional state rather than strategy.
The data-driven approach doesn’t eliminate the emotions. Dopamine after a big win is biological. What it does is create a record of the behavioral consequences — specific trades, specific costs, specific sequences — that make the pattern impossible to rationalize away. You cannot argue with timestamps and dollar amounts.
Every Euphoria badge that appears in your journal is information. It marks the exact moment where discipline ended and emotion took over. Used consistently in your review process, that information becomes the foundation of a trading process that gets incrementally better over time.
Winning is easy. Keeping your winnings is the skill.
Ready to see your own Euphoria patterns? Start your free beta account — behavioral detection runs automatically on every trade you import.
Pronto para Dominar Sua Psicologia de Trading?
Junte-se ao Trandence e deixe a análise com IA detectar o tilt, reforçar seu playbook e avaliar sua execução.
Começar Teste Gratuito