
Dashboard
Dashboard is the command center for trading performance. It combines period-level KPIs, fixed analysis views, weakness detection, analytics pills, an algorithmic period report with copy-ready AI prompts, and a customizable widget layout.
Period Controls
Dashboard analysis is scoped by the active period. Use the header controls to switch between:
- 1M - last one month.
- 3M - last three months.
- 1Y - last twelve months.
- Custom - a manually selected date range.
The browser remembers the selected preset, so refreshing the page restores the same period. When you choose a custom range, the KPI bar, widgets, weakness insights, and analytics all reload against the same dates.
KPI Bar
The fixed KPI bar stays at the top of Dashboard and summarizes the active period. It uses the same trade data and P&L mode as the rest of the page, so changing period or switching gross/net P&L affects the entire Dashboard consistently.
Dashboard Views
Dashboard has four views. The browser remembers the active view for the next visit.
General
General shows the primary performance charts:
- Equity curve.
- Day-of-week performance.
- Time-of-day performance.
Use it for a fast read on whether performance is improving and where returns cluster.
Weaknesses
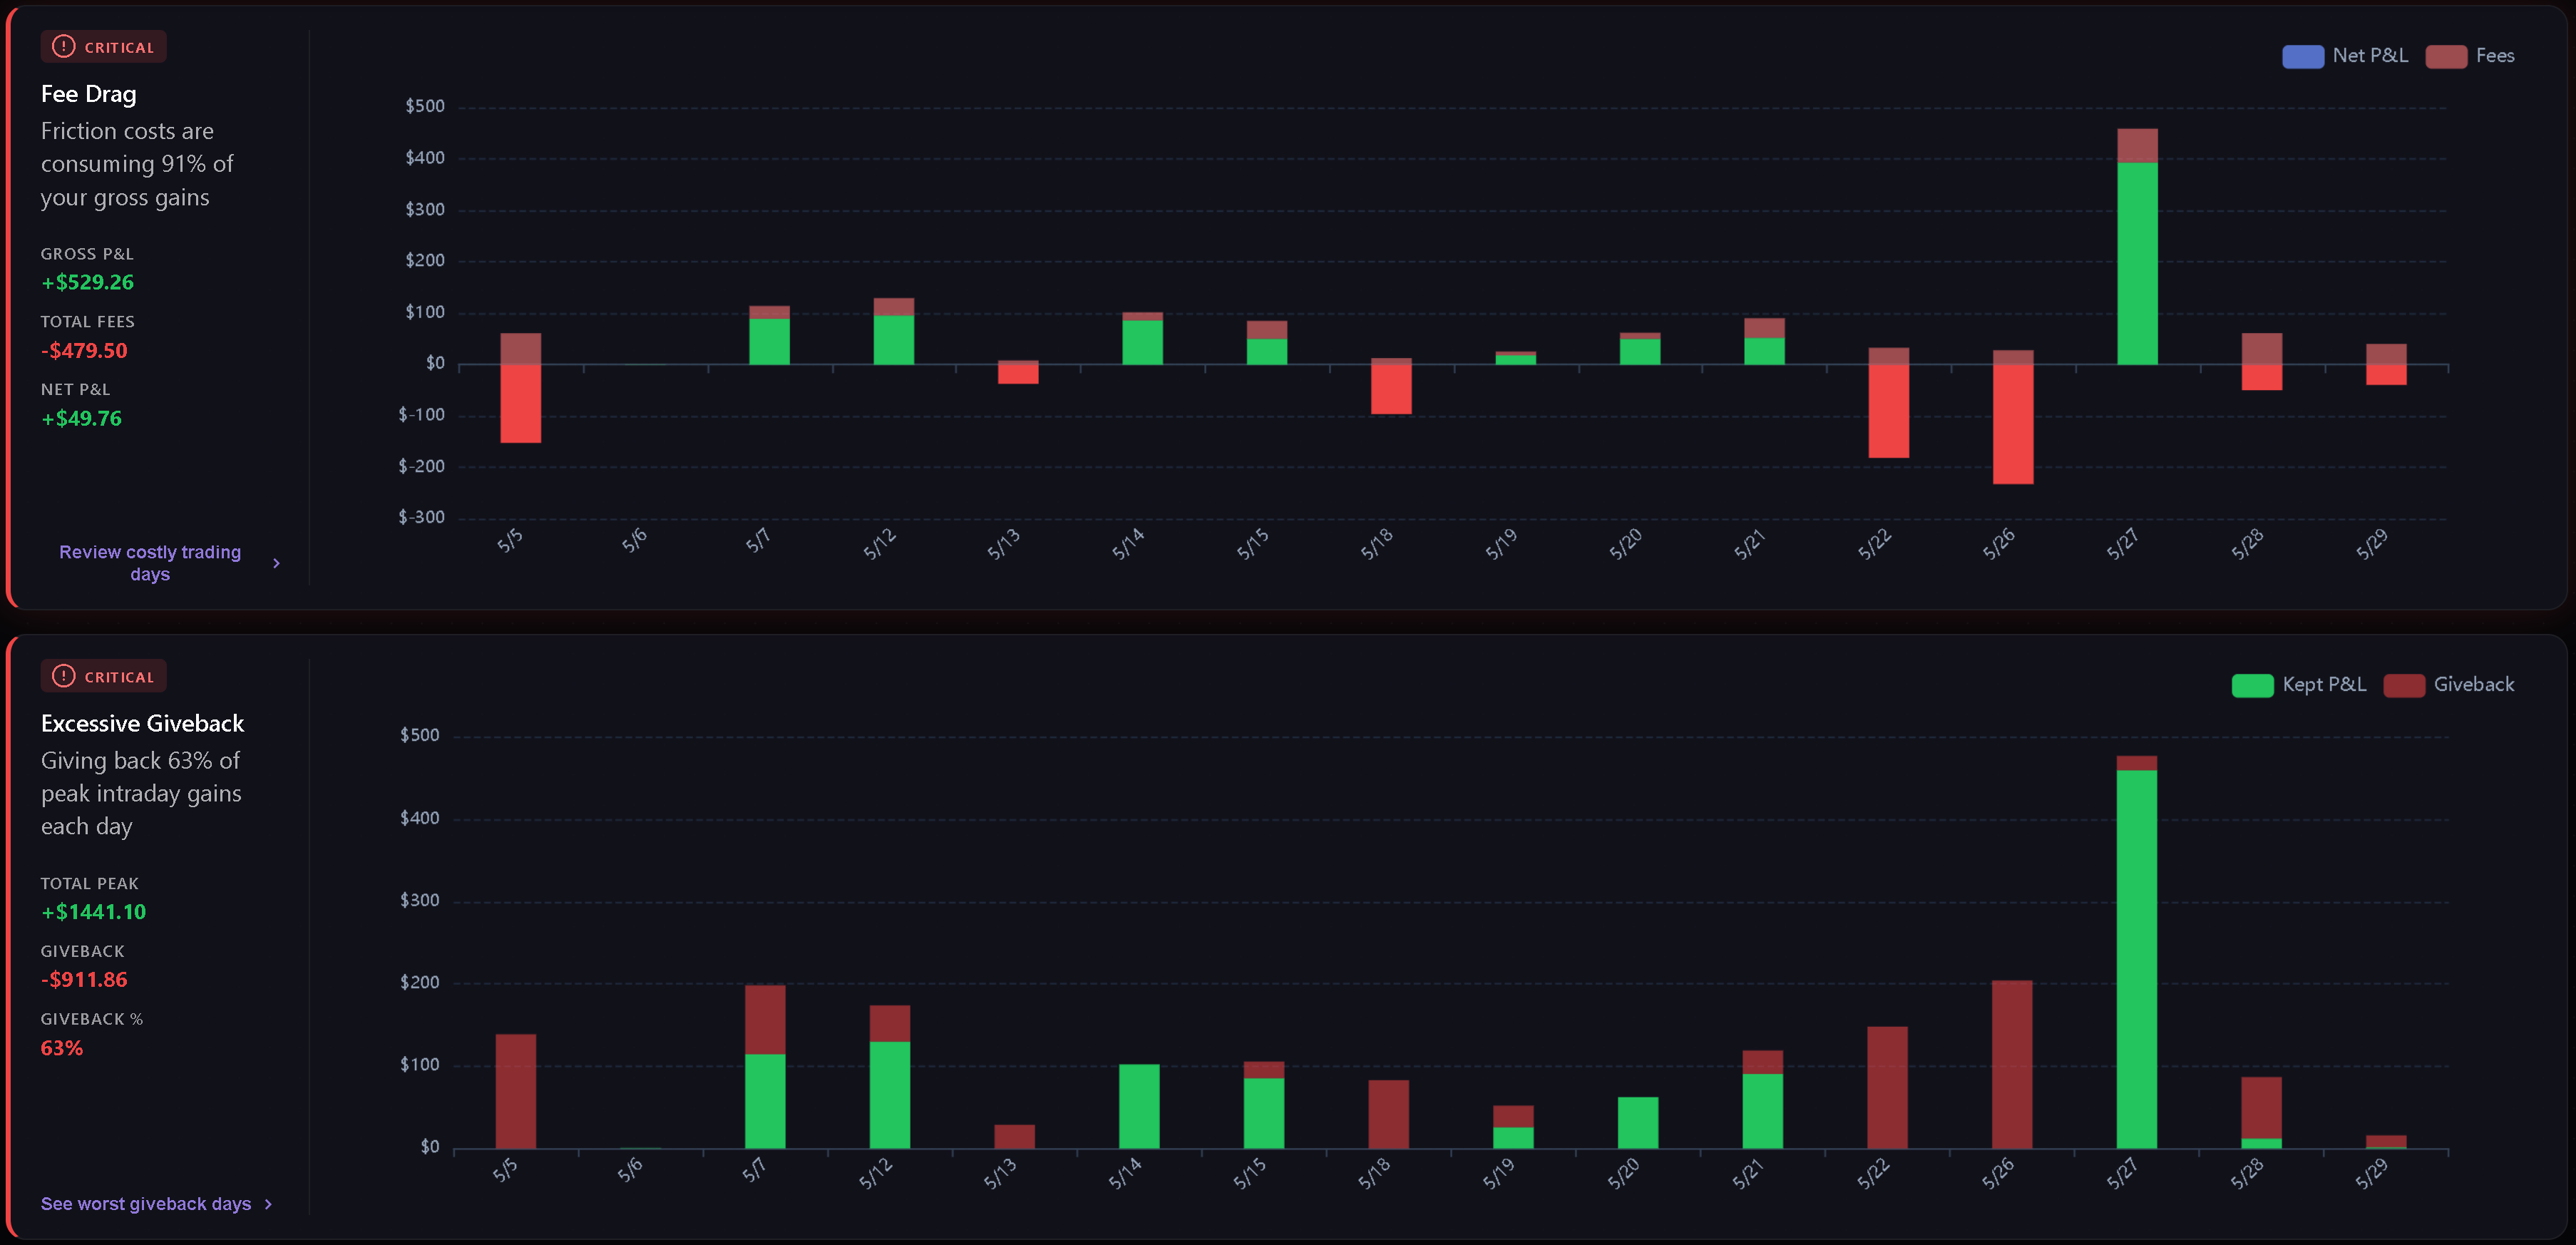
Weaknesses detects and sorts the most important leaks in the selected period, from your own trades.
Current weakness categories include:
- Fee Drag - how much commissions and fees consume gross gains.
- Excessive Giveback - how much peak intraday profit is lost before the close.
- Hold Time Asymmetry - whether losing trades are held much longer than winning trades.
- Overtrading - how often daily trade count exceeds the configured threshold.
- Cost of Tilt - the gap between disciplined P&L and actual P&L when behavioral tags are present.
- Behavioral Summary - the top psychological leak and related tag frequency.
Cards are sorted by severity first, then score. Normal metric cards are hidden, and an all-clear state appears when there are trades but no critical or warning metric weaknesses.
Analytics
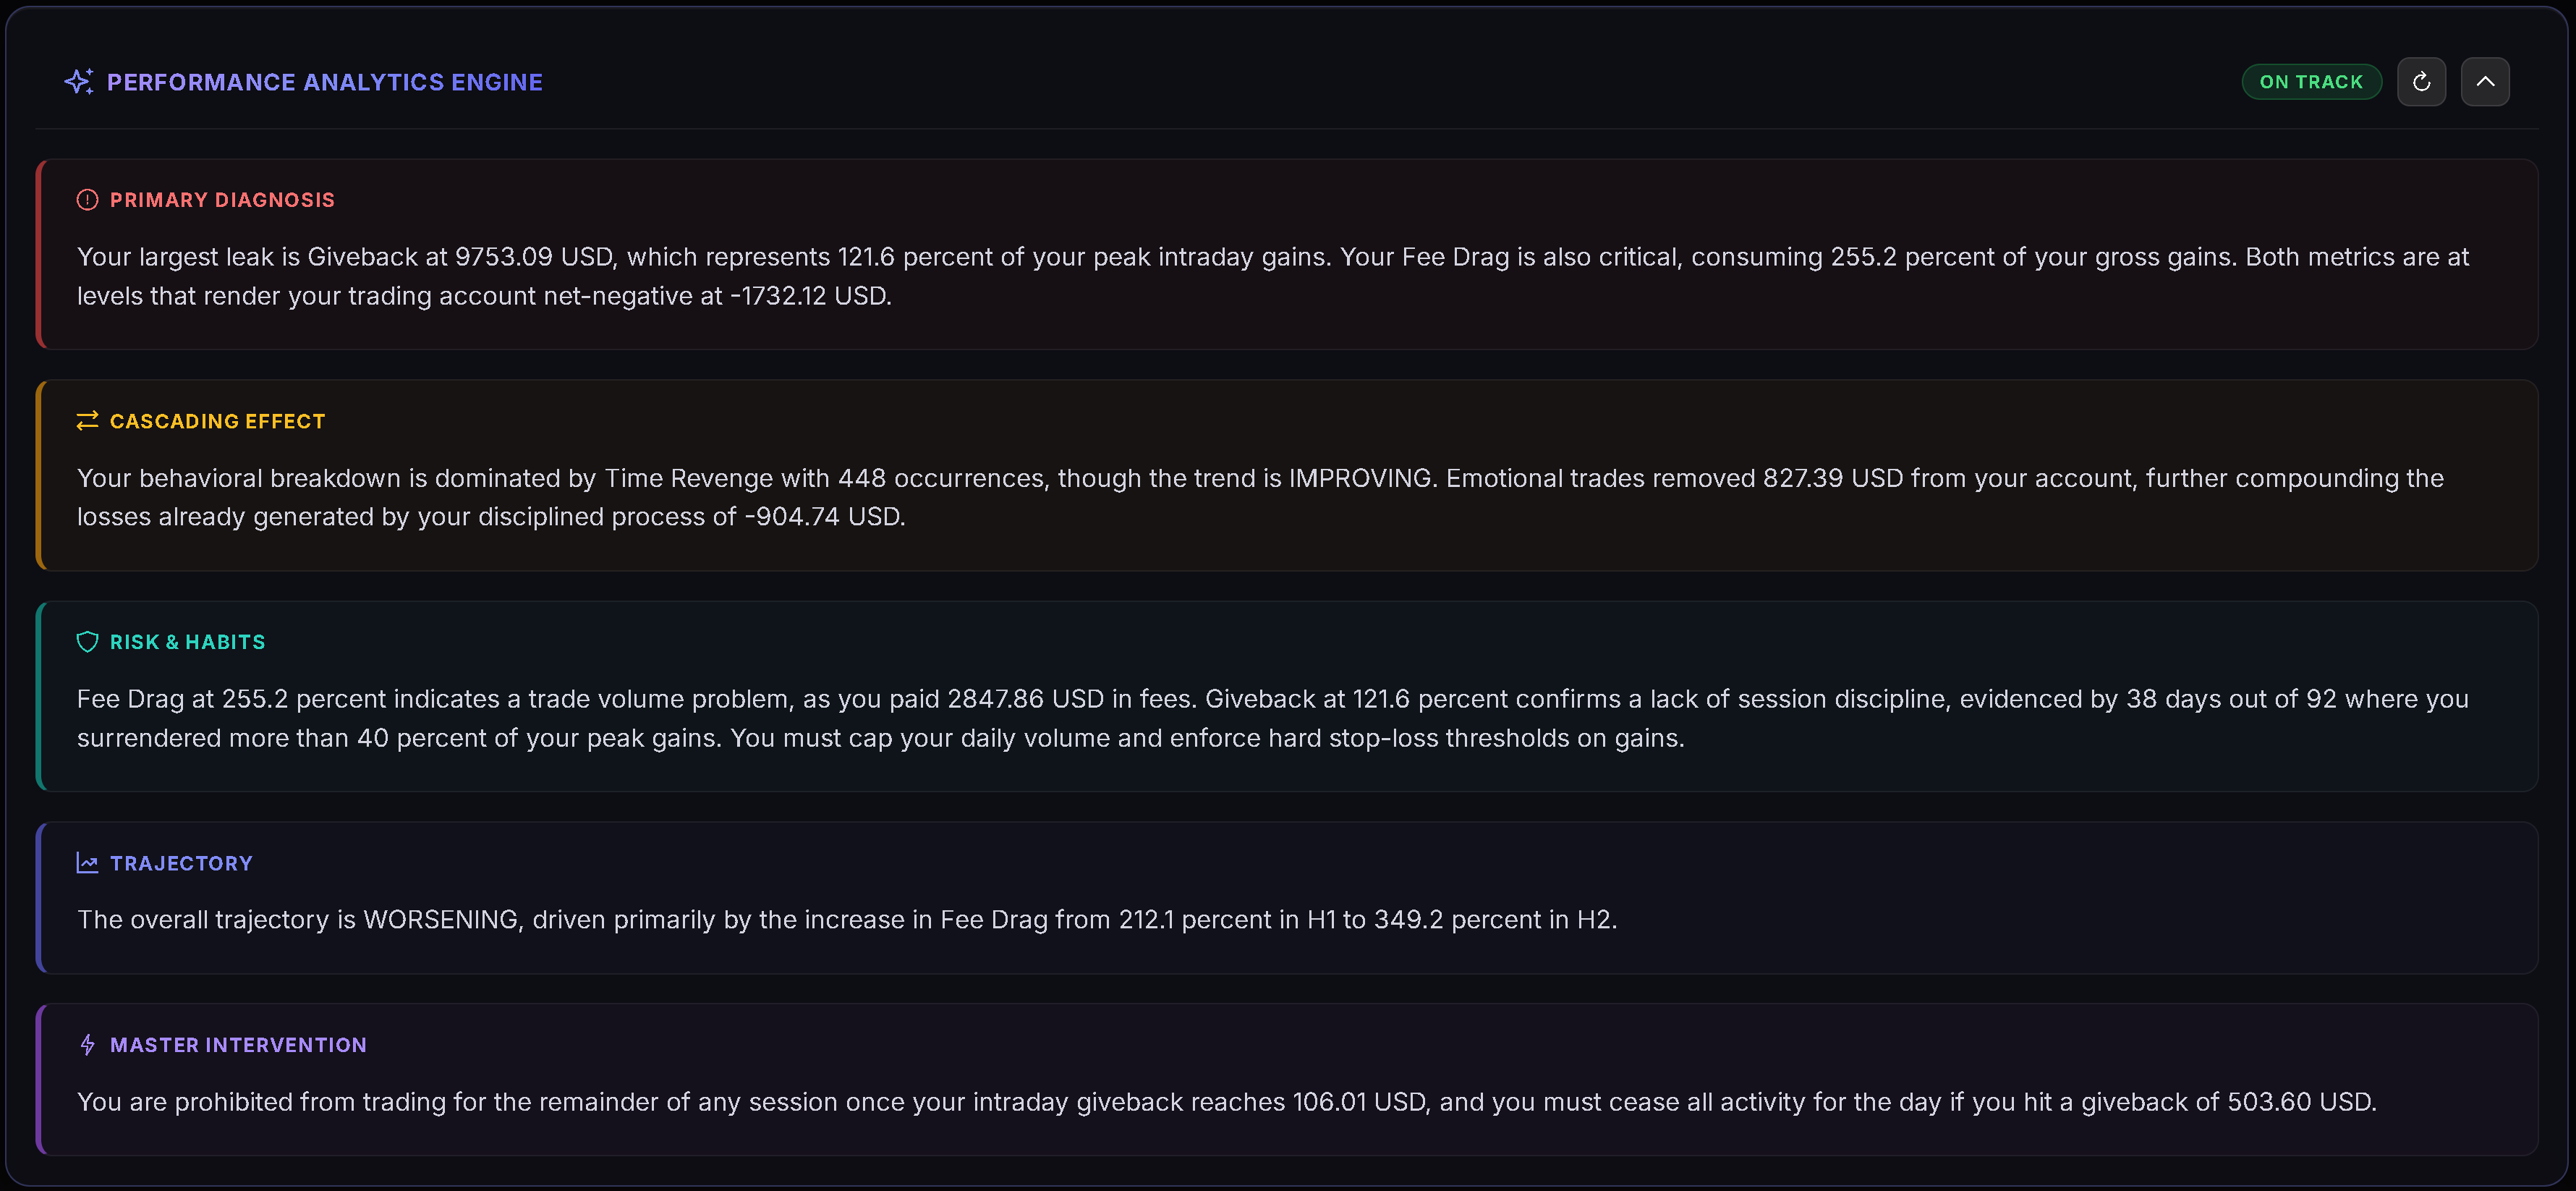
Analytics groups deeper breakdowns into four pills: Playbooks, Tags, Quality, and Discipline. The browser remembers the active analytics pill for the next visit.
See Dashboard Analytics for the full breakdown of what each pill reads and when charts appear.
Custom
Custom is a Gridster layout where you can arrange your own widgets. Click Edit Layout to enter edit mode, then add, remove, move, or resize widgets. Click Done to save the layout.
Dashboard remembers your custom layout and keeps the available widget set current over time.
Custom Widgets
Available widgets include:
- Decision Verdict.
- Edge Decomposition.
- Tomorrow Plan.
- Risk Integrity.
- Discipline Radar.
- Regime & Context.
- Cumulative P&L Chart.
- Performance by Month.
- Hold Time Analysis.
- Avg Win vs Loss.
- Largest Gain/Loss.
- Time of Day P&L.
- Behavioral Leaks.
- Fee Drag Analysis.
Some widgets appear only when the selected period has enough data to make the view useful.
Period Report (Algorithmic)
The period report sits at the top of the Dashboard, above the General / Weaknesses / Analytics tabs, and shows on all three. When 1M, 3M, or 1Y is selected, it covers the last completed month, quarter, or year (it does not appear for a Custom date range). A toolbar button (e.g. “2025 report”, “Q3 2026 report”) shows or hides it.
The period report is computed deterministically by Trandence’s own code with no AI and contains:
- a verdict line;
- “Where the money went”: up to three leaks, ordered by dollar impact (fees, a costly half-hour, a weekday worse per trade than average, re-entries within 5 minutes of a loss, trading after 3 losses in a row, overtrading days, exceeding your daily stop, outsized losing days, giveback, a losing playbook);
- “What works”: up to two strengths;
- “Rules for next period”: two rules built from your own numbers;
- notes when the sample is small or few trades have a playbook.
Each finding requires at least 5 trades.
Copy prompt for AI
A “Copy prompt for AI” button on the period report header copies a ready-made prompt with your numbers that you can paste into any AI assistant you choose (Claude, ChatGPT, Gemini, or any other). Trandence builds the prompt on its own server from your journal and hands it to your browser to copy; it never sends it to an AI provider — you decide where to paste it. If the browser blocks the clipboard, the prompt opens in a dialog to copy by hand.
Related Articles
- Dashboard Analytics
- Dashboard Decision Engine
- Calendar Period Insights
- Daily Plans
- Symbol Reviews
- Playbooks
Need Help?
If Dashboard numbers do not match the period you expect, check the active date range, P&L mode, and whether the relevant trades are imported for that period. For help, contact help@trandence.com.
Need Help?
Questions about Dashboard? We answer within one business day.