Every trader knows that emotions affect performance. Very few traders have ever measured it. The gap between believing that your mood matters and having statistical proof of exactly how much it matters is the difference between vague self-awareness and actionable intelligence.
Trandence closes that gap.
The Cost of Untracked Emotion
Consider this scenario: you sit down to trade after a poor night of sleep. You feel sluggish. You tag your pre-session mood as “Tired” in your Trandence journal, or perhaps you skip the tag entirely because you are eager to catch the opening range.
Over the next 90 minutes, you take four trades. Three are losers. Your stop discipline is loose. Your entries are late. At the end of the session, your P&L reads -2.1R, and you attribute the result to “bad tape” or “choppy price action.”
But the tape was not the problem. Your execution was the problem. And your execution was the problem because your cognitive state was compromised before you ever placed a trade. Without a systematic record of emotional state, this pattern repeats invisibly, week after week, eroding your edge one “bad day” at a time.
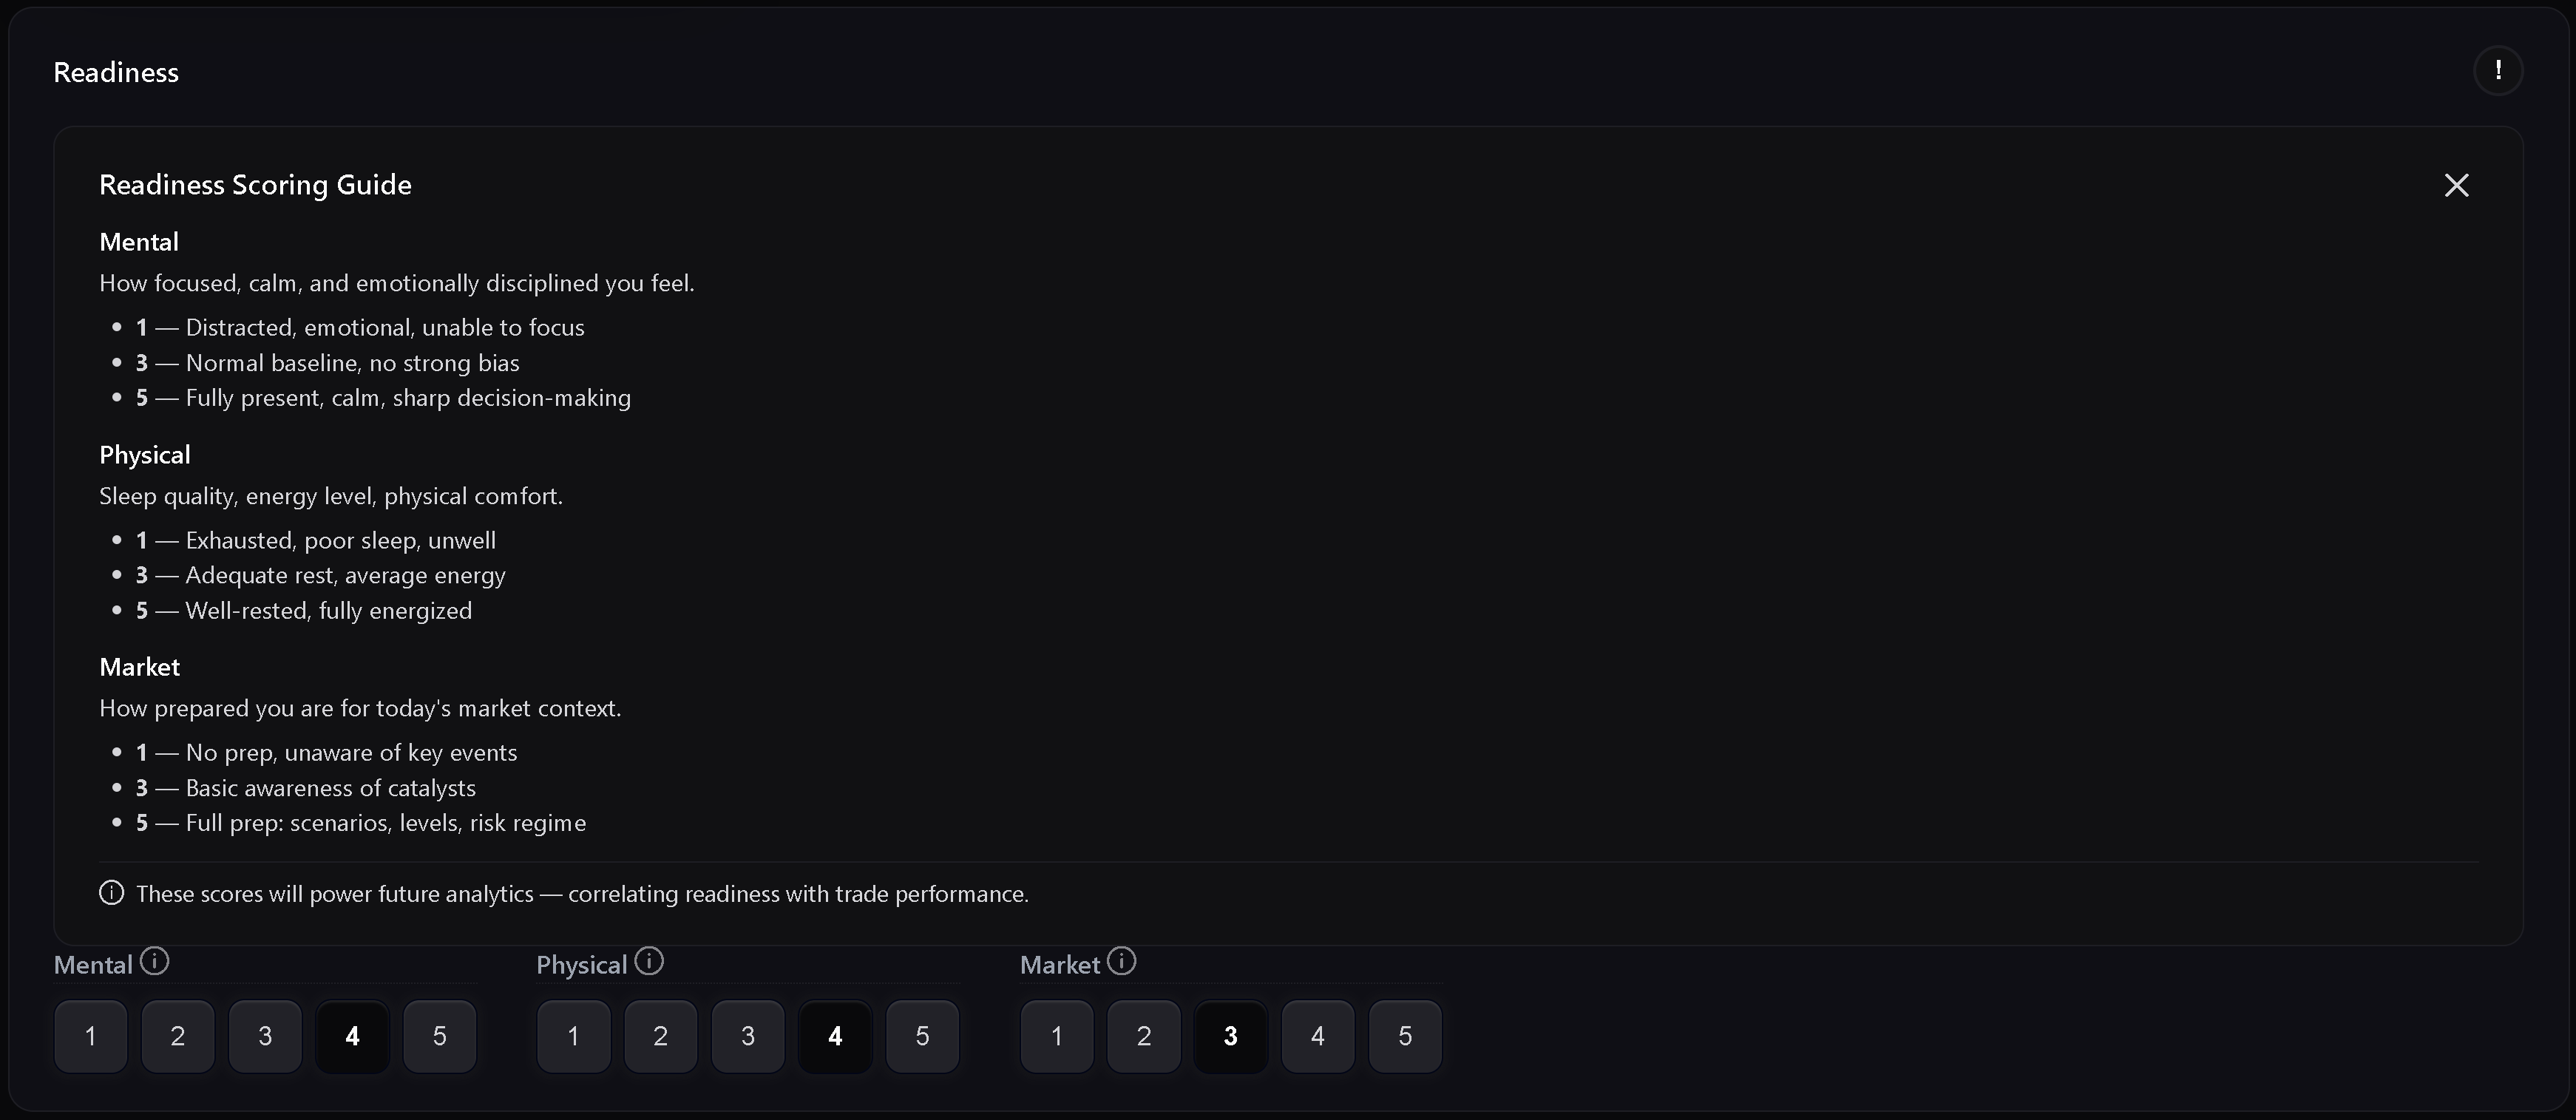
How Mood Tagging Works
Trandence provides a structured pre-session mood tagging system. Before you deploy capital, you select from a set of defined emotional states:
- Focused — Clear-headed, well-rested, sharp decision-making capacity.
- Anxious — Elevated stress, heightened loss aversion, tendency to cut winners early.
- Tired — Cognitive fatigue, slower reaction time, increased tolerance for sloppy entries.
- Confident — Positive but controlled, trust in the process and the playbook.
- Frustrated — Residual emotion from prior losses, elevated revenge-trade risk.
- Neutral — No strong emotional bias in either direction.
These tags are qualitative inputs. They take less than five seconds to record. But when aggregated over dozens or hundreds of sessions, they become one of the most powerful analytical dimensions in your entire trading dataset.
How the algorithmic engine Processes Emotional Data
The Performance Analytics Engine treats mood tags as a first-class analytical variable, correlating them against every quantitative metric in your trading history. The engine performs the following analysis:
Success Rate by Emotional State
The most immediate correlation is between your tagged mood and your session success rate. Over a statistically significant sample (minimum 20 sessions per tag), the algorithmic engine calculates your success rate segmented by emotional state.
A typical output might reveal:
| Mood Tag | Sessions | Success Rate | Avg R-Multiple | Avg Commission Drag |
|---|---|---|---|---|
| Focused | 47 | 62% | +1.4R | 0.08R |
| Confident | 31 | 58% | +1.1R | 0.09R |
| Neutral | 22 | 51% | +0.6R | 0.11R |
| Anxious | 18 | 28% | -0.9R | 0.15R |
| Tired | 14 | 31% | -0.7R | 0.14R |
| Frustrated | 9 | 19% | -1.6R | 0.18R |
The data above is illustrative, but the pattern it reveals is universal: the variance between your best and worst emotional states is almost always larger than the variance between your best and worst setups. Most traders spend months optimizing their entry criteria while ignoring a variable, their own cognitive state, that has a greater impact on their results. Meanwhile, hidden costs like commission drag compound the damage from emotionally-driven overtrading.
R-Multiple Distribution by Mood
Beyond success rate, the algorithmic engine analyzes how your average gain and average loss change by emotional state. Traders in a “Focused” state typically show tighter stop discipline (smaller average losses) and better trade management (larger average gains). Traders in a “Frustrated” state show the opposite: widened stops, premature exits on winners, and inflated commission drag from overtrading.
Commission Drag Analysis
A subtle but critical dimension: the algorithmic engine tracks commission drag per mood state. Traders in negative emotional states tend to overtrade, which increases their cost basis. A “Frustrated” trader who takes 12 trades instead of their normal 4 is paying three times the commissions for a fraction of the expected value. Thealgorithmic engine exposes this hidden cost explicitly.
The Statistical Feedback Loop
The true power of emotional correlation is not the initial insight. It is the feedback loop it creates.
When you open Trandence and see, in clear statistical terms, that your success rate drops from 62% when “Focused” to 19% when “Frustrated,” you are no longer relying on self-awareness or willpower to make pre-session decisions. You have objective proof.
This proof transforms the pre-session question from “Do I feel like trading today?” (which is subjective and easily rationalized) to “What does my data say about trading in this state?” (which is objective and unambiguous).
The Decision Framework
Based on accumulated emotional correlation data, Trandence enables you to build a personal Decision Matrix:
- Green Zone (Focused, Confident): Full position sizing, full trade count allowance. Your data supports aggressive execution in these states.
- Yellow Zone (Neutral): Reduced position sizing (e.g., 50% of maximum). Limit to high-conviction A-grade setups only. Your data shows acceptable but not optimal performance.
- Red Zone (Anxious, Tired, Frustrated): Do not trade. Implement your Hard Stop Protocol and walk away. Your data shows a negative expected value in these states. No amount of “good setups” compensates for a compromised decision-making process.
The framework is not prescriptive. It is derived from your own data, which makes it far more compelling than any external rule. You cannot argue with your own track record.
From Subjective to Systematic
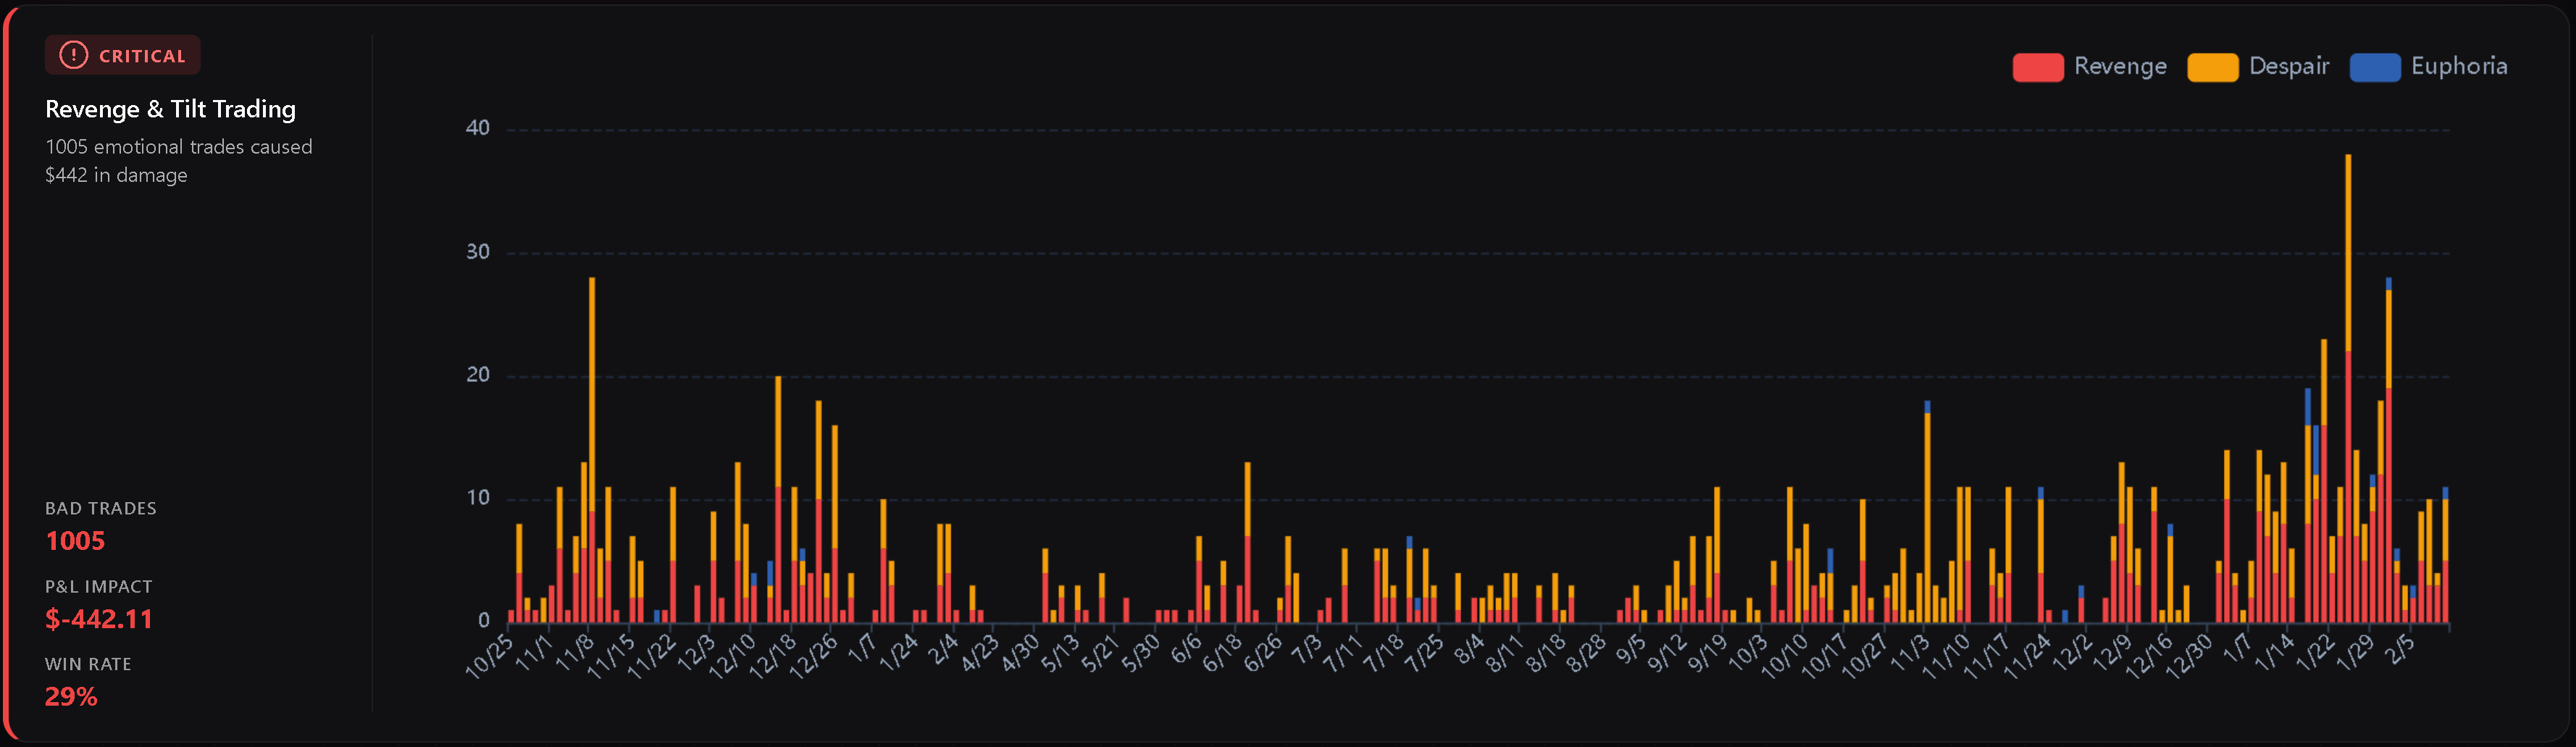
The emotional correlation engine does not ask you to stop feeling. It asks you to start measuring. Every mood tag you record is a data point that strengthens the model. Over time, the algorithmic engine’s analysis becomes increasingly precise, revealing not just which states are harmful, but the specific execution failures (wider stops, late entries, overtrading) that manifest within each state — including post-win euphoria cascades that are invisible to raw P&L.
This is the institutional approach to psychology. It does not rely on meditation, mantras, or motivation. It relies on data, feedback, and systematic decision rules built from your own performance history — the same Playbook-driven discipline used by professional desks.
Need Help?
If you have questions about configuring your mood tags, understanding the correlation tables, or building your personal Decision Matrix, reach out to us at help@trandence.com — we’re ready to assist you.