You just got stopped out for the second time in 15 minutes. The setup was clean. The thesis was right. But the market ran your level by three cents and reversed without you. You can feel it building: the tightness in your chest, the narrowing focus, the voice that says “I need to make this back.”
You are now in tilt, and every trade you take from this point forward has a negative expected value.
The Mechanics of Emotional Tilt
Tilt is not a metaphor. It is a measurable neurochemical state. When a trader experiences consecutive losses — particularly losses that feel unjust or irrational — the brain’s amygdala overrides the prefrontal cortex. Rational analysis is replaced by emotional reactivity. Risk assessment degrades. The trader stops executing a strategy and starts fighting the market.
The behavioral fingerprint of tilt is consistent and predictable:
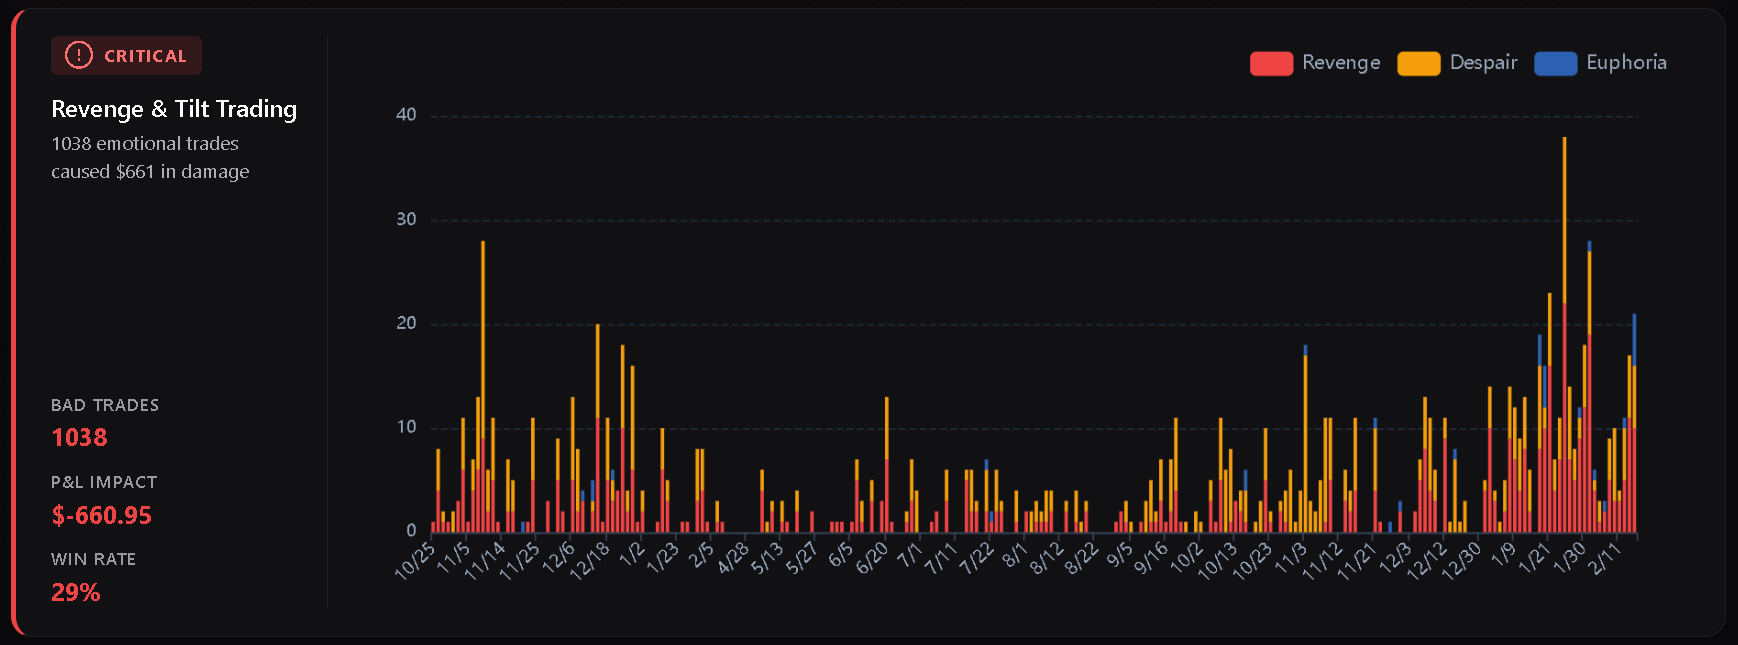
- Rapid-fire execution: Trade frequency spikes dramatically. A trader who normally takes 4–6 trades per session suddenly takes 12–15, searching for the one that “makes it all back.”
- Sizing escalation: Position sizes increase with each consecutive loss, violating predefined risk parameters. The trader is no longer managing risk — they are gambling.
- Stop-loss manipulation: Hard stops are widened or removed entirely, converting small, planned losses into catastrophic drawdowns.
- Off-plan entries: Trades are taken on setups that do not exist in any defined Playbook. The entry trigger is emotion, not price action.
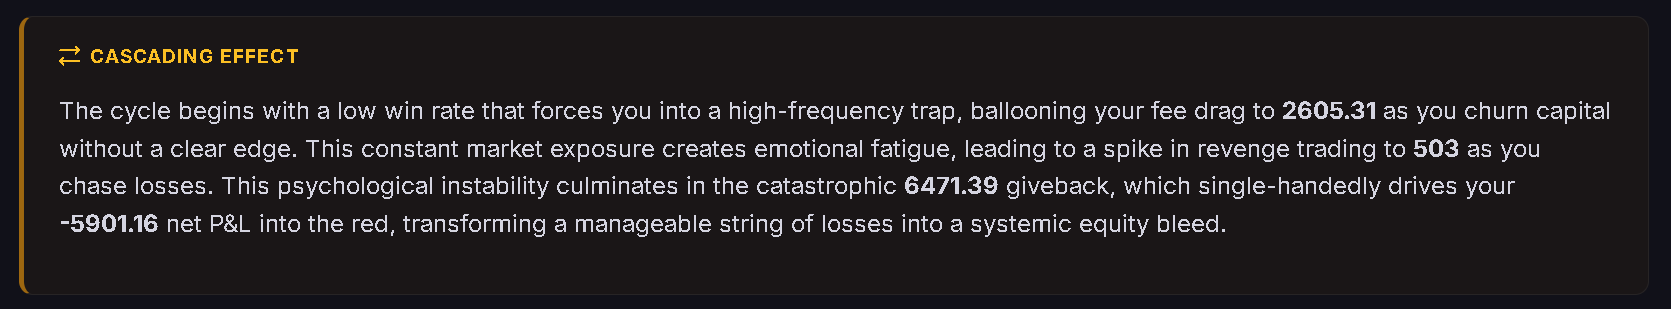
The mathematical consequence is devastating. A trader in tilt is not just losing money on individual trades — they are simultaneously increasing position sizing, increasing trade count, and increasing commission drag. The compounding effect can wipe out a week of disciplined gains in a single session.
How the algorithmic engine Detects Tilt
The Performance Analytics Engine does not rely on you to self-diagnose tilt. It detects the pattern automatically by monitoring your execution data against your historical baseline. The engine analyzes three primary dimensions:
1. Trade Velocity Analysis
Thealgorithmic engine tracks the time interval between consecutive trades. Every trader has a natural rhythm — a baseline pace that reflects their decision-making process. When that interval compresses dramatically (e.g., from an average of 12 minutes between trades to 90 seconds), the engine flags the acceleration as a tilt indicator.
This is particularly powerful because velocity changes are invisible to the trader in the moment. You don’t realize you’re firing off trades at triple your normal rate. Thealgorithmic engine does.
2. Post-Loss Behavioral Sequencing
The most destructive tilt pattern is the loss-chase sequence: a trade hits its stop, and the trader immediately re-enters the market — often within seconds — with the same directional bias or an inverted position. Thealgorithmic engine identifies these sequences by analyzing:
- Time-to-next-trade after a loss: If the interval is significantly shorter than your baseline, it indicates an emotional rather than analytical entry decision.
- Directional correlation: If you reverse your position immediately after a stop-out on the same symbol, the algorithmic engine flags this as a revenge trade.
- Sizing deviation: If the follow-up trade is larger than the previous one, the pattern matches the classic escalation spiral.
3. Commission Drag Spike Detection
A subtle but critical signal: the algorithmic engine monitors your intra-session commission drag ratio. A trader in tilt overtrades aggressively, causing their commission costs to spike relative to their gross P&L. When the algorithmic engine detects that your session’s fee drag has exceeded a healthy threshold (typically 30% of gross P&L), it flags the session as high-risk.
This metric alone often reveals tilt that would otherwise be masked by a “breakeven” day. You might finish the session flat, but if you churned through 40 trades and paid $200 in commissions to do it, you didn’t break even — you paid the house for the privilege of destroying your edge.
The Quantified Cost of Tilt
The most powerful aspect of tilt detection is not the real-time flag — it is the historical pattern analysis that reveals just how much tilt has cost you over weeks and months.
A typical output from the Performance Analyzer might show:
| Metric | Baseline Sessions | Tilt-Flagged Sessions |
|---|---|---|
| Avg. Trade Count | 5.2 | 14.8 |
| Success Rate | 58% | 24% |
| Avg. R-Multiple | +1.1R | -1.9R |
| Commission Drag | 8% | 42% |
| Playbook Adherence | 81% | 22% |
The data is unambiguous: tilt sessions are not just unprofitable — they are systematically destructive. The combination of reduced success rate, inflated sizing, and tripled commission drag creates a compounding loss that far exceeds the initial stop-out that triggered the emotional state.
The Corrective Framework
The Three-Strike Rule
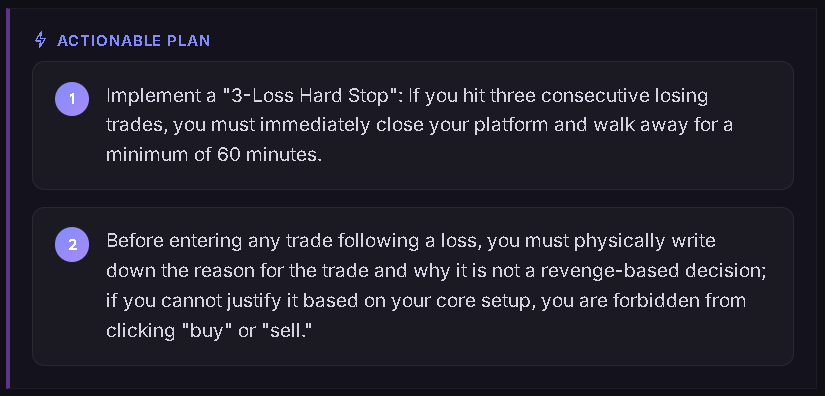
The most effective mechanical countermeasure against tilt is the three-strike rule: after three consecutive losing trades, you stop trading for a minimum of 30 minutes. No exceptions. No “one more try.”
This is not about superstition — it is about breaking the neurochemical feedback loop. The amygdala needs approximately 20–30 minutes to disengage from a heightened state. By enforcing a physical separation from the terminal, you give your prefrontal cortex time to regain control of your decision-making process.
The Daily Hard Stop
Beyond the three-strike cooldown, every trader needs a daily maximum loss limit — a predefined drawdown that, once hit, ends the session entirely. This is your absolute circuit breaker. (For a complete implementation guide, see Setting Up a Hard Stop Protocol.)
The Hard Stop converts the vague intention of “I’ll stop if it gets bad” into a binary, non-negotiable rule. When the number is hit, you log your trades, read the Performance Analyzer’s verdict, and walk away.
The Pre-Session Readiness Check
The best tilt management is prevention. By tagging your emotional state before every session, you create a baseline awareness of your psychological vulnerability. If you sit down to trade already “Frustrated” or “Anxious,” your historical data (via the Emotional Correlation Engine) will tell you exactly what to expect: reduced success rate, inflated losses, and a high probability of tilt.
The rational response is not to “try harder.” It is to reduce sizing, limit trade count, or skip the session entirely.
From Reactive to Systematic
Every trader will experience tilt. The neurochemistry of loss aversion guarantees it. The difference between a trader who blows up and a trader who survives is not emotional control — it is process.
Tilt detection is not about preventing emotion. It is about creating a system that catches you when your emotions have already taken over. Thealgorithmic engine flags what your brain cannot see in the moment. The Hard Stop enforces what your willpower cannot enforce under pressure. The historical data proves, session after session, that the cost of “one more trade” is always higher than the cost of walking away.
Combined with Euphoria Effect analysis — which catches the same pattern on the winning side — Trandence gives you a complete psychological audit of both your worst and best moments. Because both states lead to the same destination: off-plan execution, inflated risk, and preventable losses.
Need Help?
If you have questions about interpreting the algorithmic engine’s tilt indicators, configuring your Hard Stop limits, or understanding the Three-Strike cooldown workflow, reach out to us at help@trandence.com — we’re ready to assist you.